


Ishanu Chattopadhyay PRO
ML | Data Science Biomedical Informatics | Social Science | Assistant Professor
Pan-genomic Digital Twins for Predictive Diagnosis of Pulmonary Fibrosis
Ishanu Chattopadhyay, PhD
Assistant Professor of Internal Medicine
Institute of Biomedical Informatics
University of Kentucky
Data
19000 samples
1.2M SNPS, SOCIAL, CLINICAL
11K SNPS, SOCIAL, CLINICAL
the variable of interest (among the ~11K) is the diagnosis state for PF: PFdx
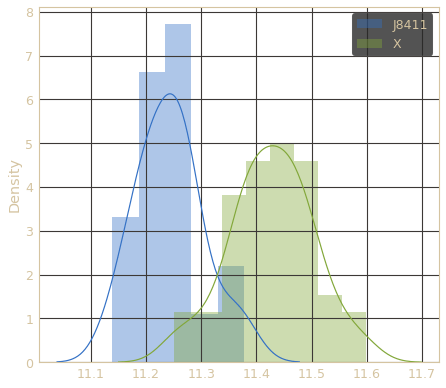
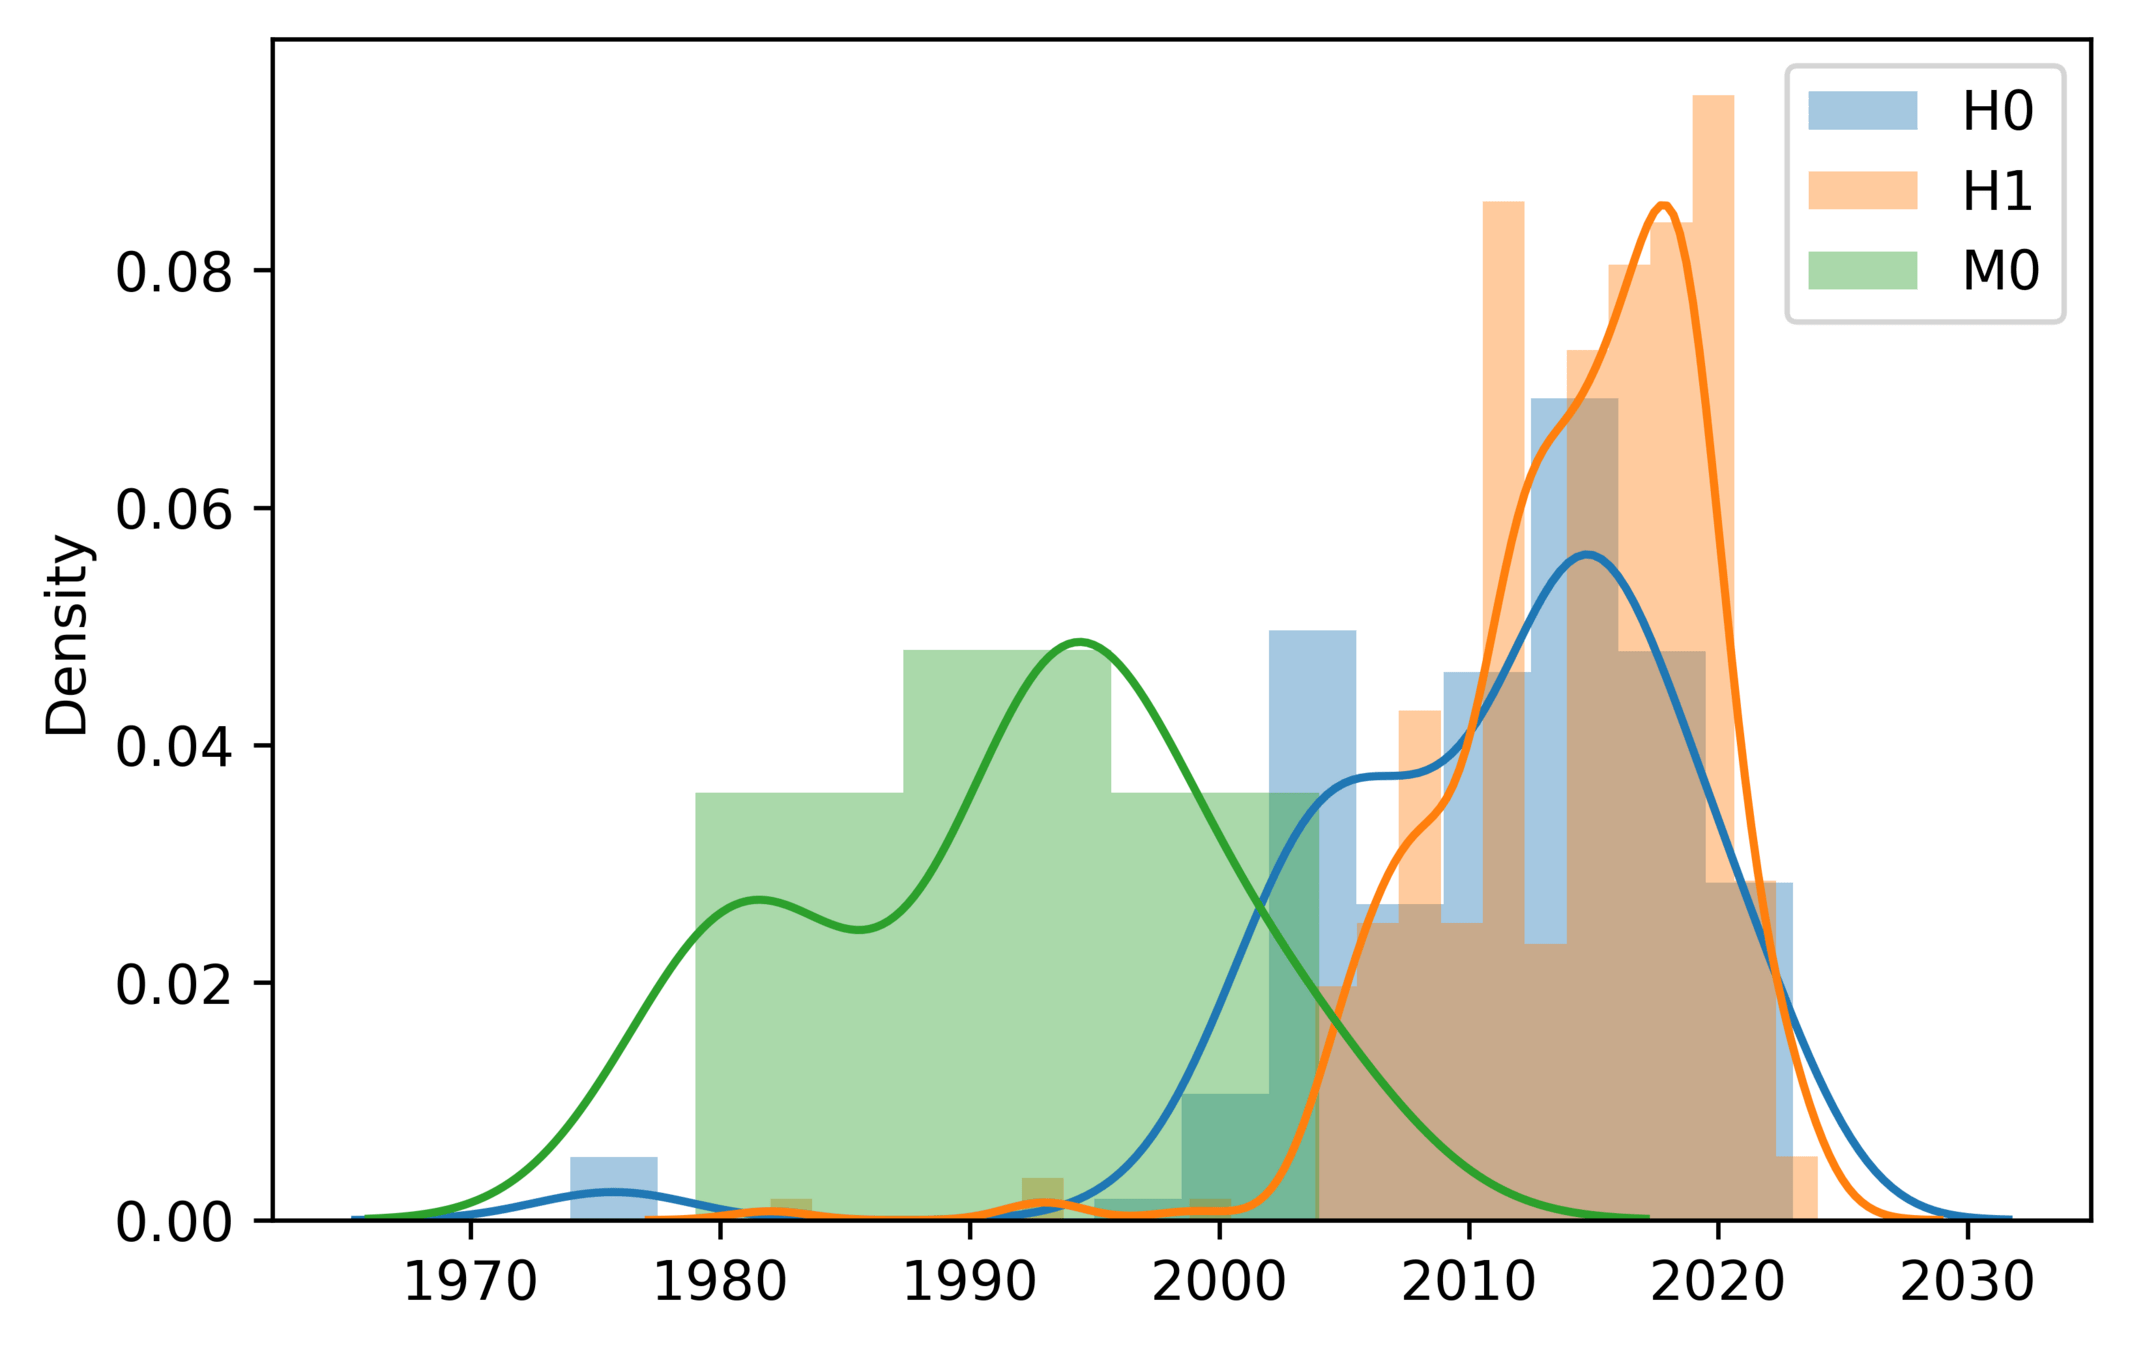
Risk distribution for samples with positive and negative PF diagnoses
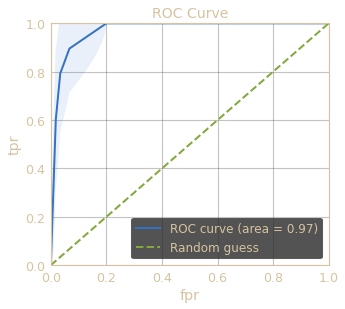
Looking ahead: OOS validation
Take oos samples, sensor PFdx and J84 clinical data, and calculate risk as defined in Eq. 1
Results
Data
Digital Twin of Data
| x1 | x2 | x3 |
|---|
| xi |
|---|
We infer a "recursive forest" that yields a generative model of the data
Predict the distribution of a variable (\(x_i\)) as function of all the other available variables
Captures the cross-talk and epistetic effects
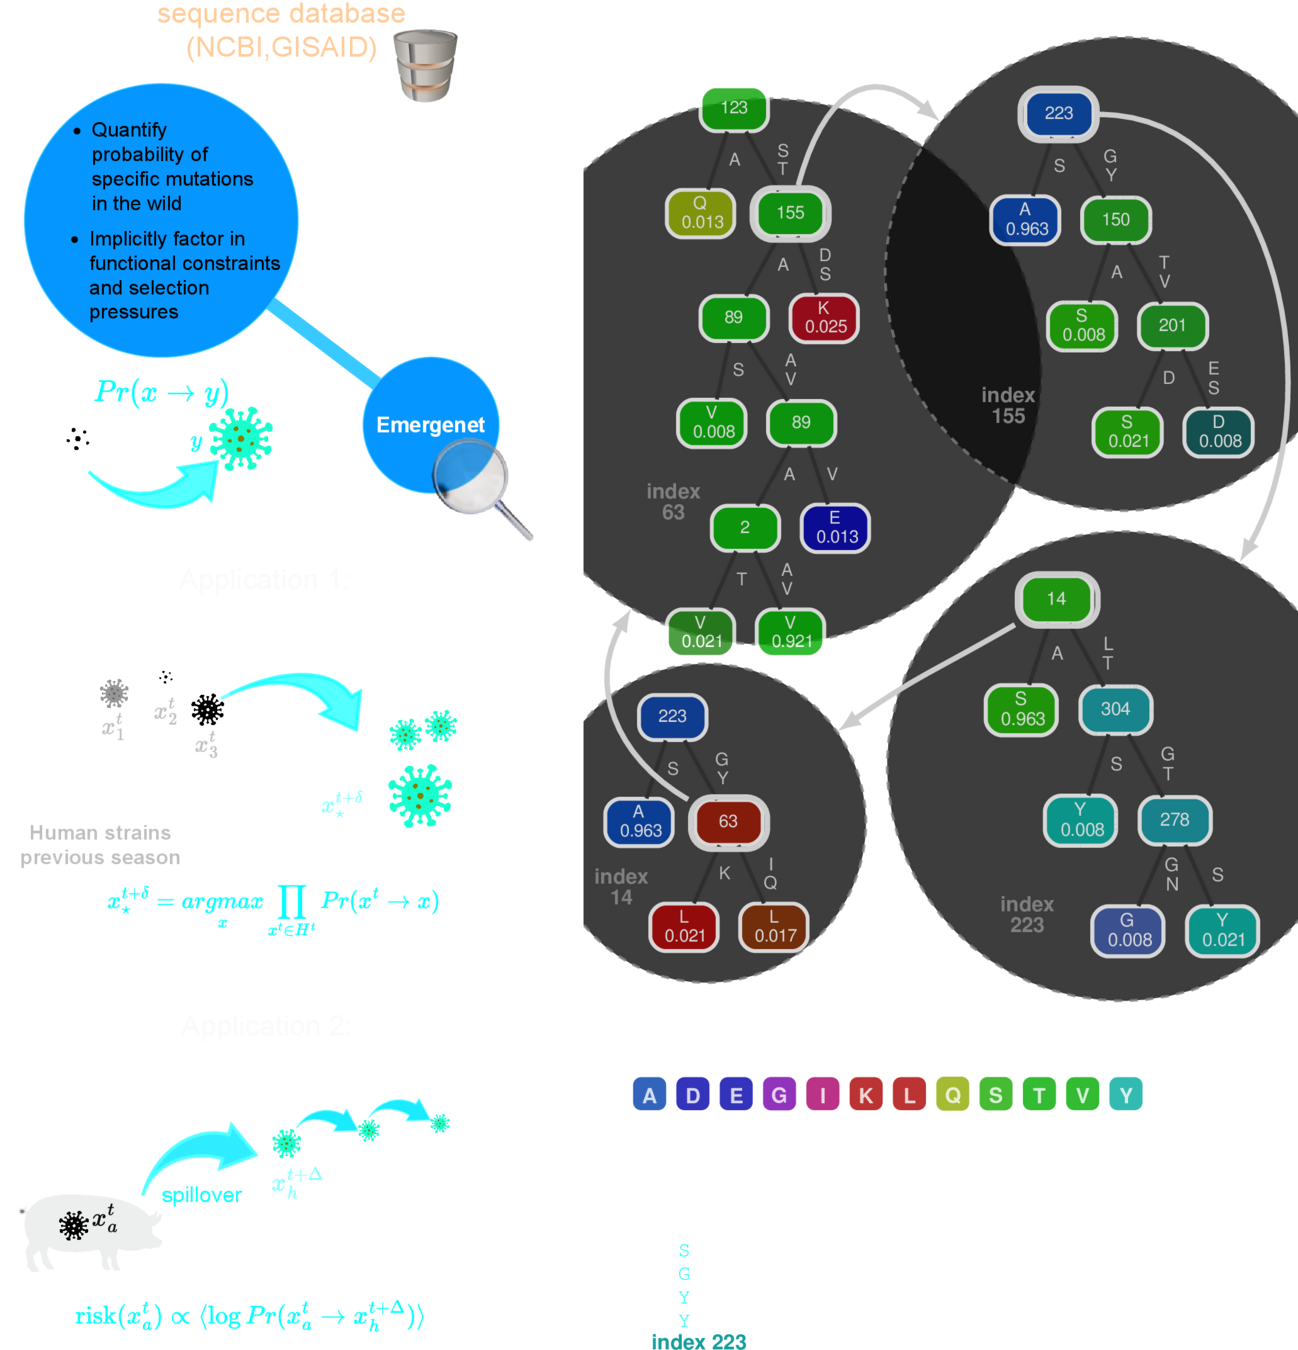
Viral genome example
This distance is "special"
$$J \textrm{ is the Jensen-Shannon divergence }$$
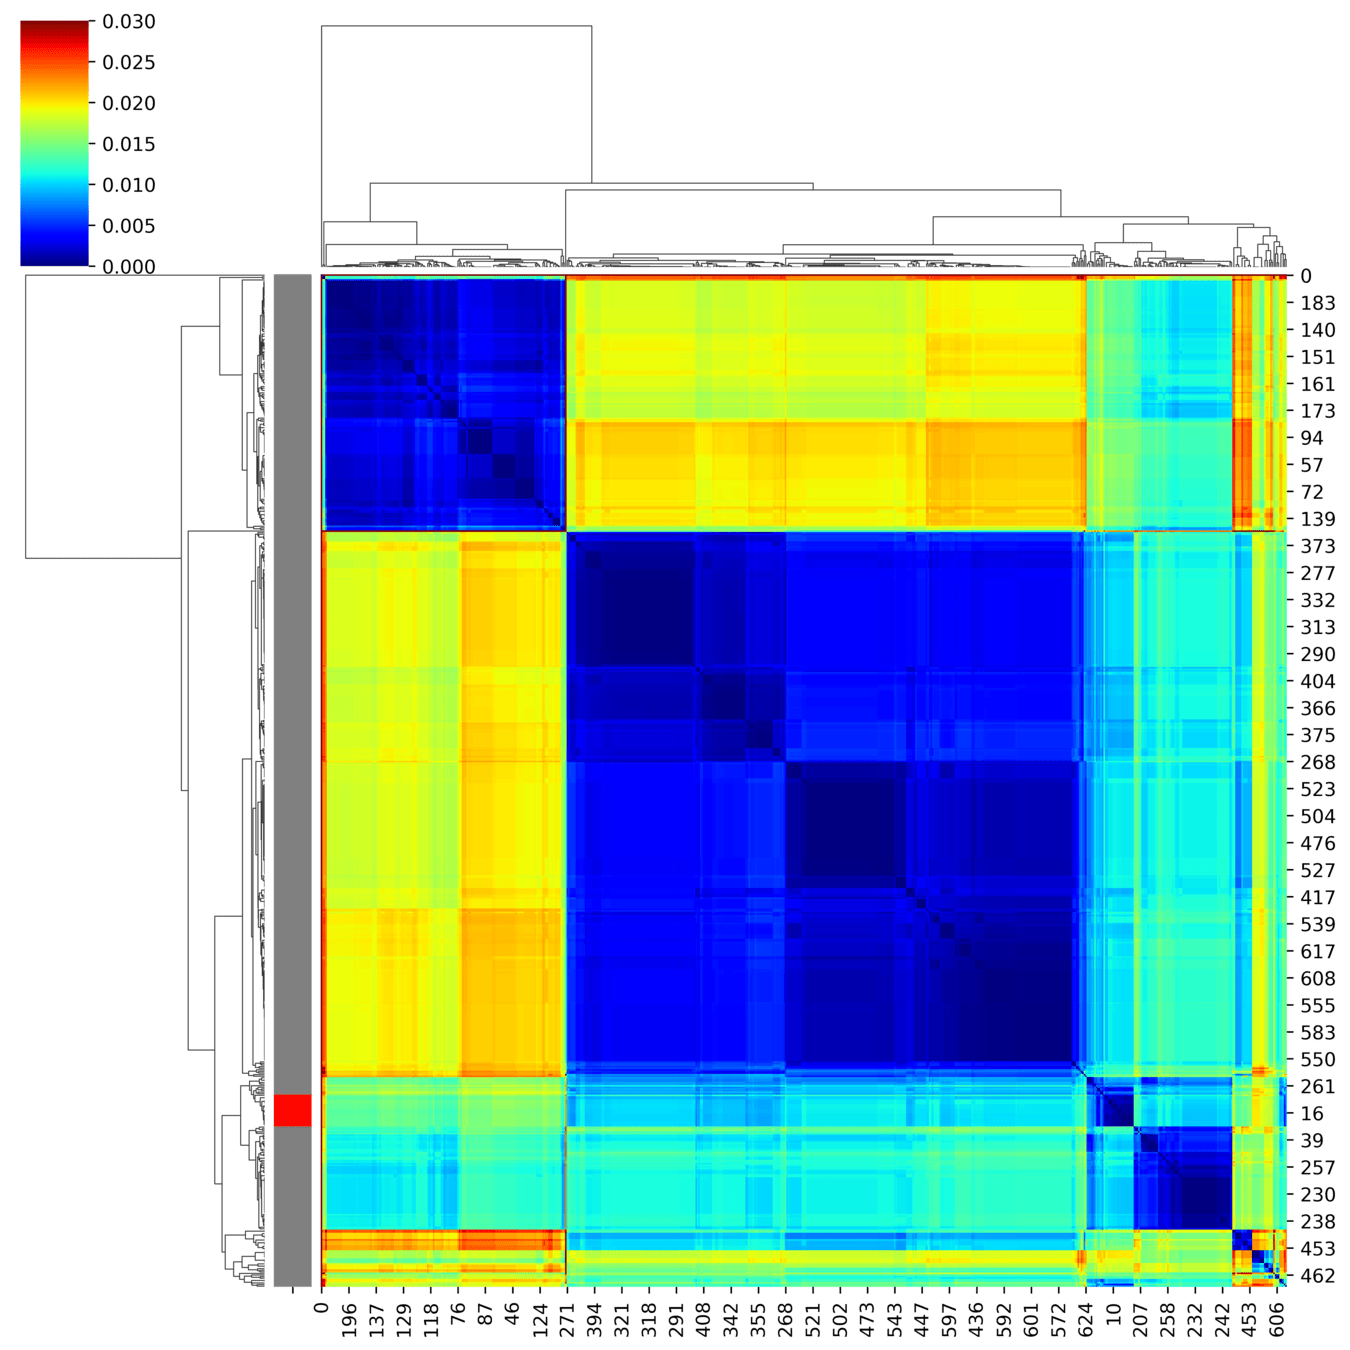
q-distance
a biologically informed, adaptive distance between samples
Smaller distances implies high probability of a "valid perturbation"
Metric Structure
Tangent Bundle
geometry
dynamics
Digital Twin of Transgenome
(limited to 10K PF correlates)
parameters: 975050
variables: 11k
samples: 12k
PFdx
MUC5b
MUC5b
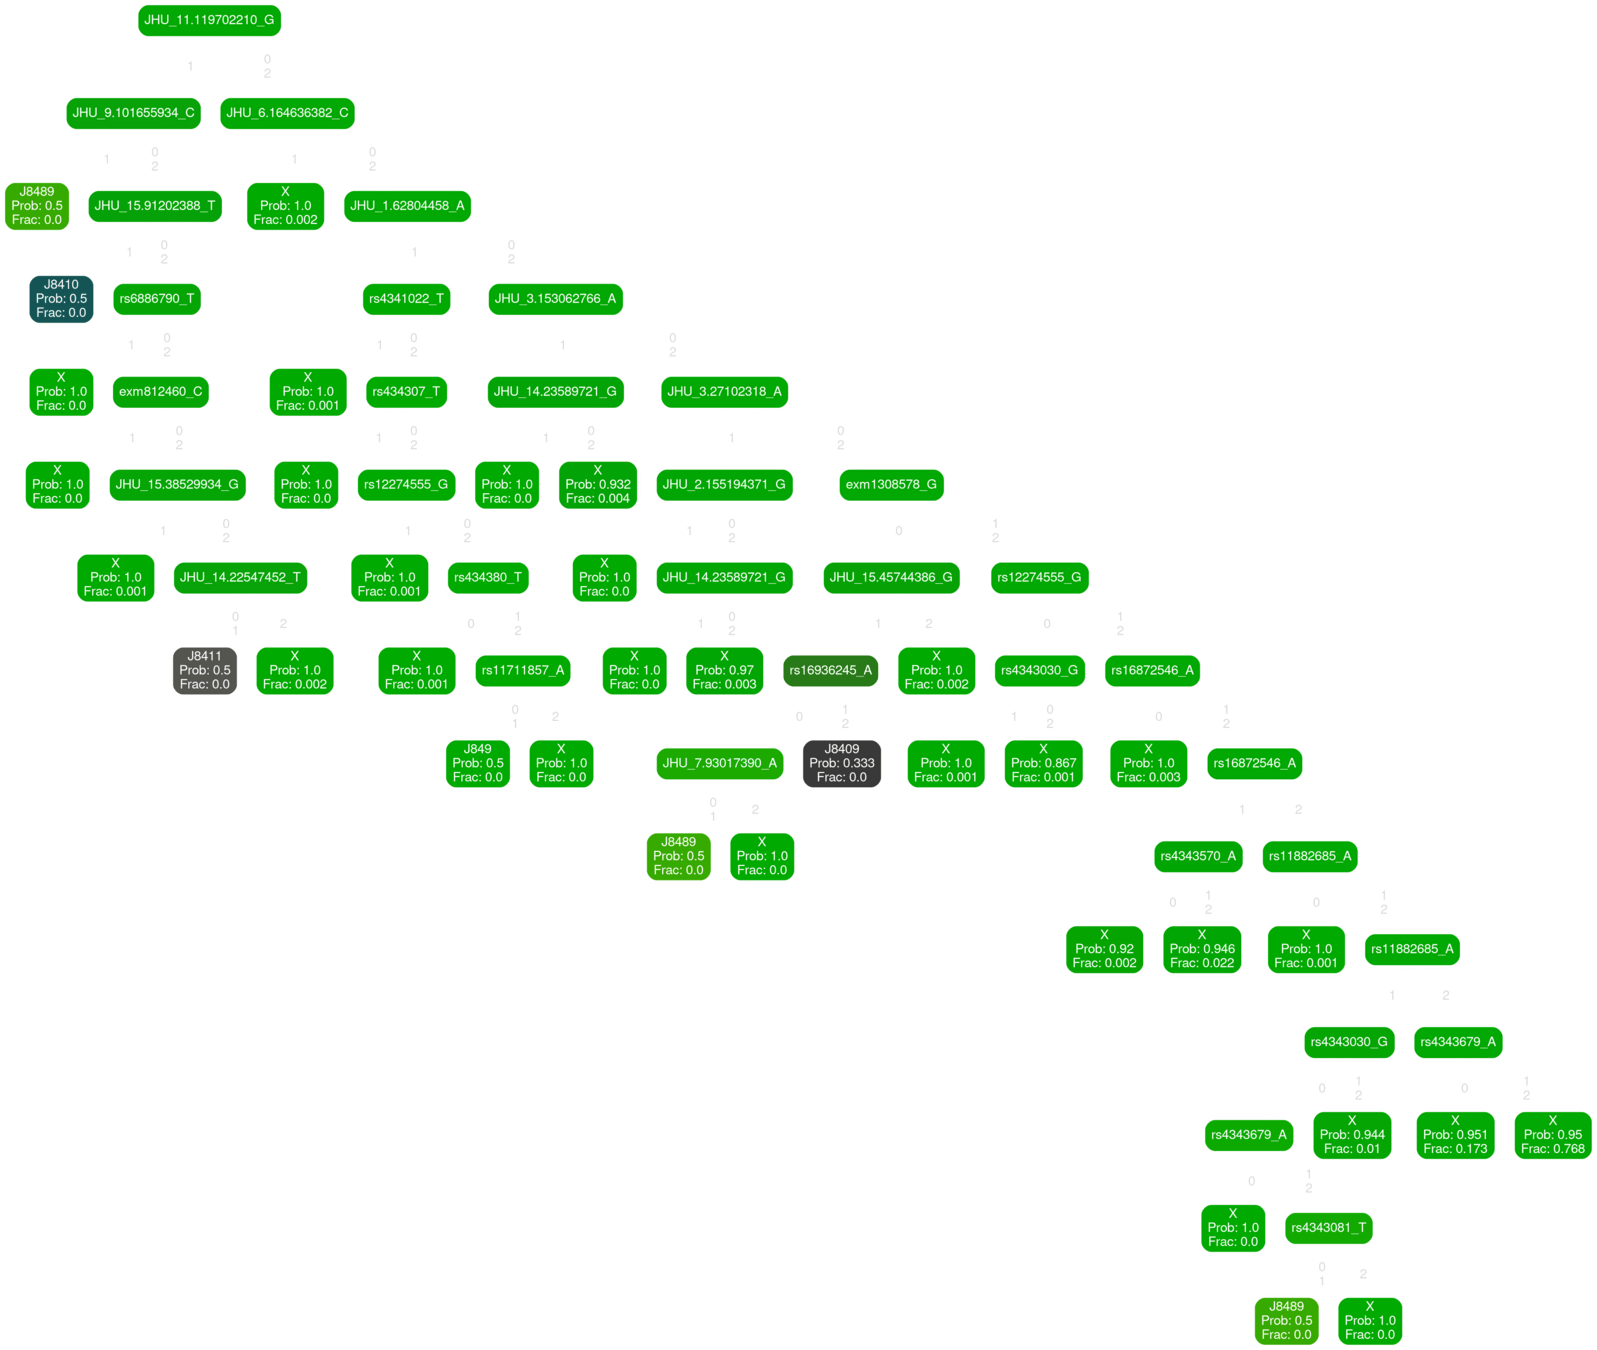
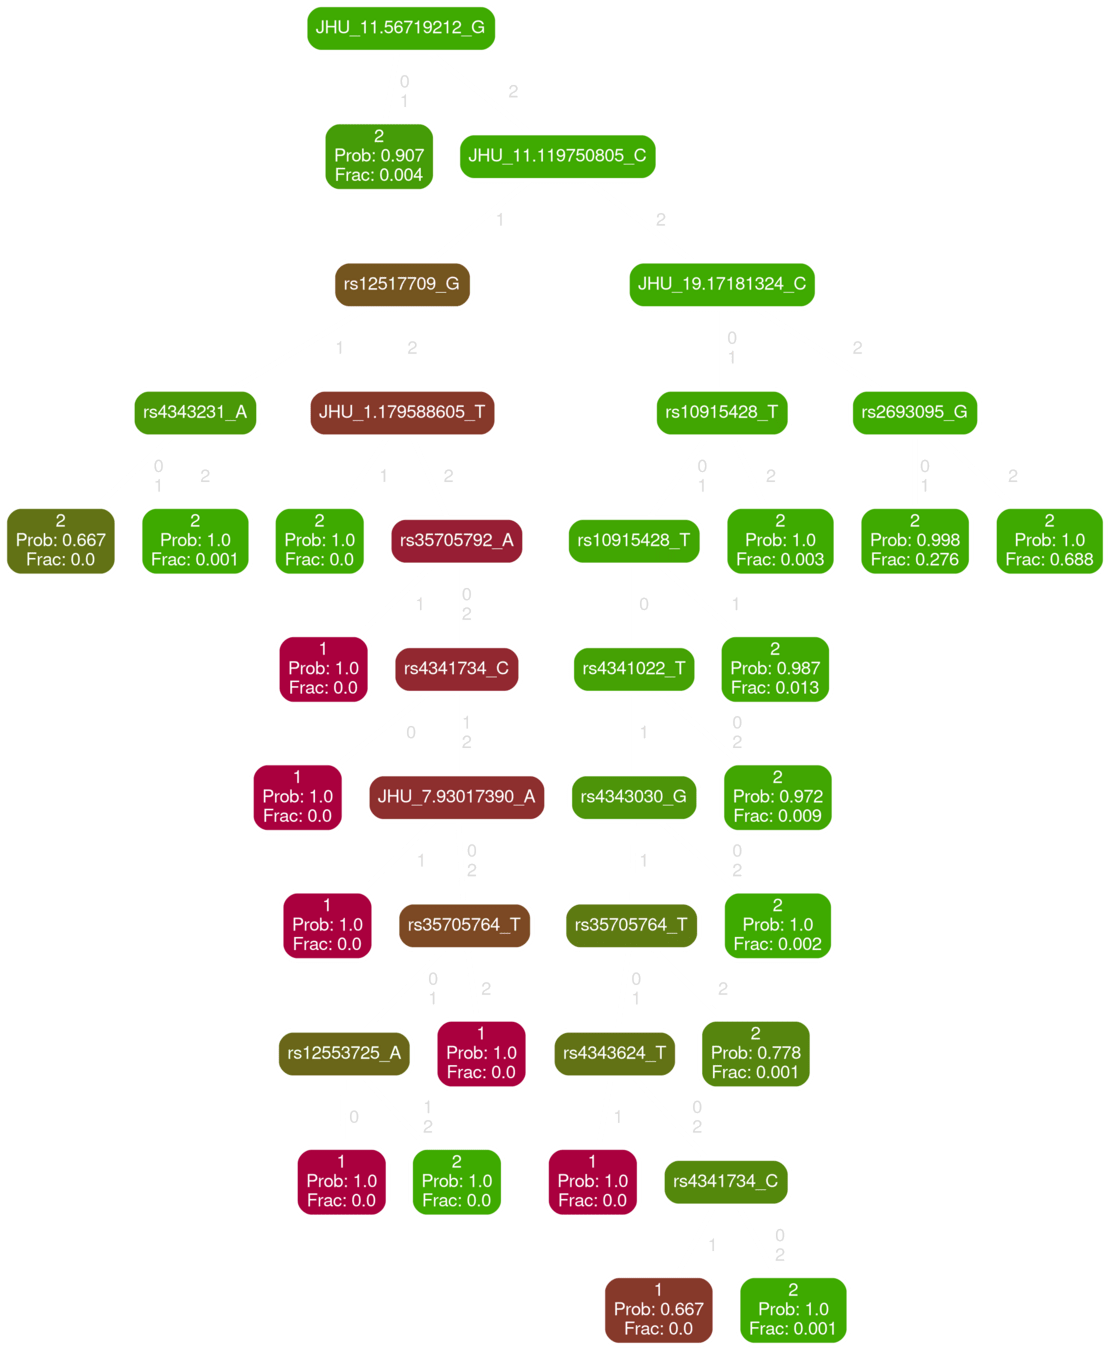
JHU_11.119702210_G
PFdx
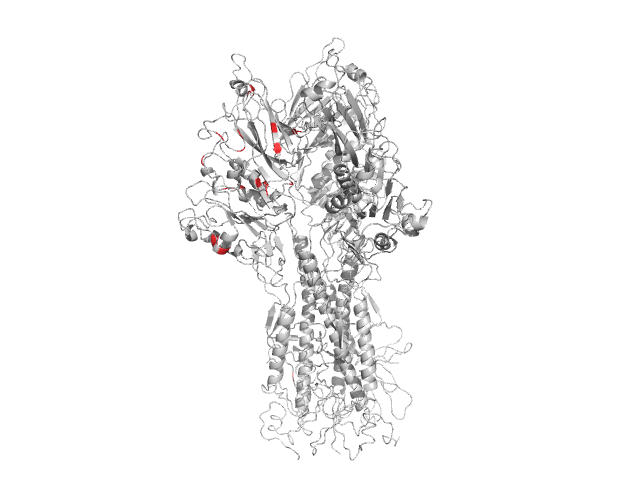
Inferred path from MUC5b promoter to PFdx outcome
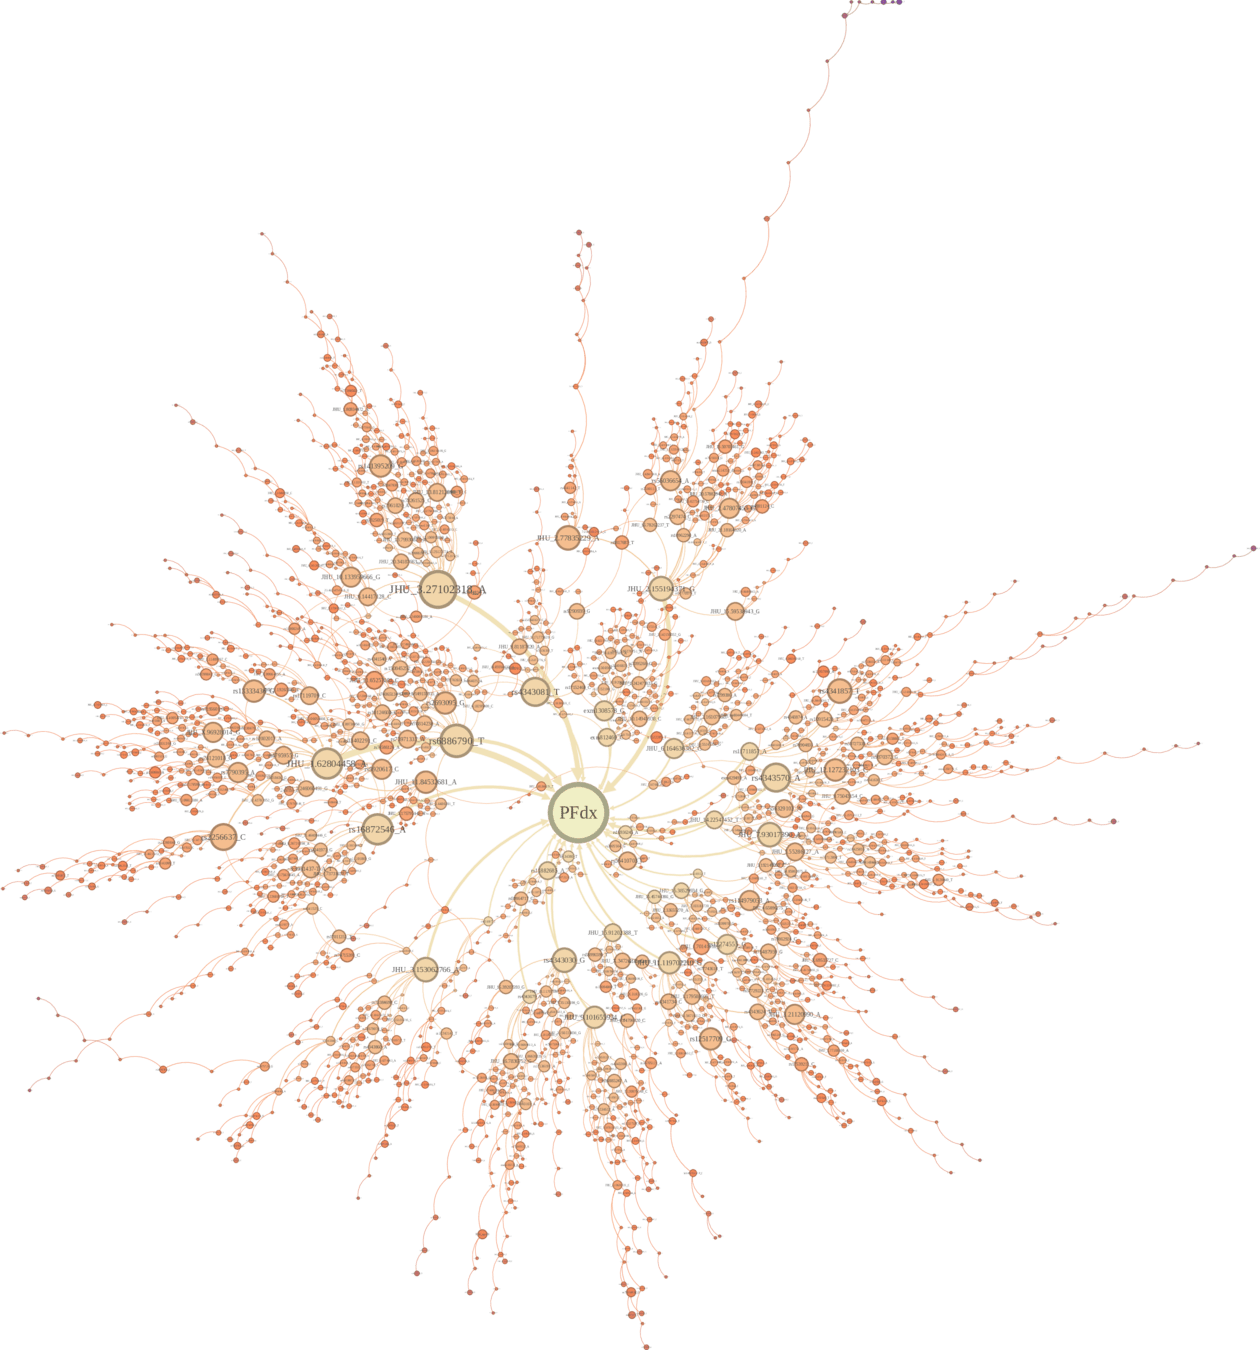
inferred network driving PF diagnosis
This is a fraction of the emergent network among our variables that "drives" the PFdx variable
inferred network driving PF diagnosis
Some qualitative match with what is know. Many "new" relationships.
Need to inspect for mechanistic meaning
Building the Classifier for PF dx
We make "anchor" perturbation samples
PF dx
no PF dx
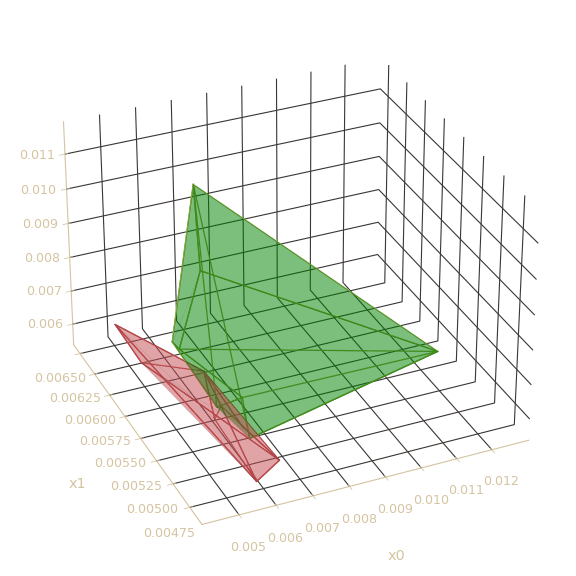
Risk of PF diagnosis
(1)
Convex hulls in Metric embedding of perturbation vectors
We make two sets of "valid perturbation" samples
Risk distribution for samples with positive and negative PF diagnoses
Out-of-sample validation
Take oos samples, sensor PFdx and J84 clinical data, and calculate risk as defined in Eq. 1
Results
By Ishanu Chattopadhyay
AI for medicine


