Content ITV PRO
This is Itvedant Content department
Calculate risk involved in F&O
Business Scenario
Your client now understands how to read the Option Chain to gauge sentiment, but they need to understand exactly what happens to their capital when the stock price moves.
A Payoff Structure illustrates the net profit or loss earned by a trader across different underlying stock prices on the day of contract expiration. To make this practical, we will evaluate trades on Reliance Industries Ltd. (RELIANCE) using a benchmark entry price of ₹1,310.30 (matching its actual trading level in July 2026).
As a Risk Analyst, your job is to answer this question by analysing the Payoff Structure of different Futures and Options strategies.
Instead of calculating everything manually, you will use the Opstra Strategy Builder to visually analyse how profits and losses change as Reliance's share price moves.
Pre-Lab Preparation
Topic : Futures & Options
1) Long and short positions
2) Payoff Chart
3) Contract life cycle
4) Mark-to-market mechanism
Task 1: Use Opstradefinedge to calculate P&L and margin requirement
The Strategy: The trader expects Reliance shares to rise aggressively.
The Trade: Buy 1 RELIANCE Futures contract at an entry price of ₹1,310.30.
Formula: Profit / Loss = Expiry Price - Entry Price
Understanding Long Futures Position
1
| Expiry Price of RELIANCE | Calculation (Expiry Price - ₹1,310.30) | Net Profit / Loss (₹ per share) |
|---|---|---|
| ₹1,200 | 1,200 - 1,310.30 | -₹110.30 (Loss) |
| ₹1,250 | 1,250 - 1,310.30 | -₹60.30 (Loss) |
| ₹1,310.30 | 1,310.30 - 1,310.30 | ₹0.00 (Break-Even) |
| ₹1,350 | 1,350 - 1,310.30 | +₹39.70 (Profit) |
| ₹1,400 | 1,400 - 1,310.30 | +₹89.70 (Profit) |
Observation: A Long Futures position offers unlimited profit potential if the stock price rises, but carries unlimited risk (loss) if the stock price falls
Open the Opstra Strategy Builder
2
Open Google Chrome or any web browser.
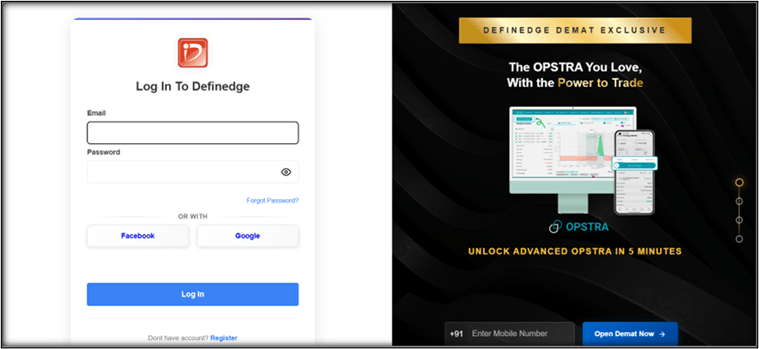
Visit the Opstra website.
https://opstra.definedge.com/strategy-builder
When the Opstra website opens, click Continue with Google.
Select your preferred Google account to log in.
If prompted, click Accept or Allow to grant the necessary permissions. After successfully logging in, you will be redirected to the Opstra Dashboard.
Configure and Add Your Futures Position
3
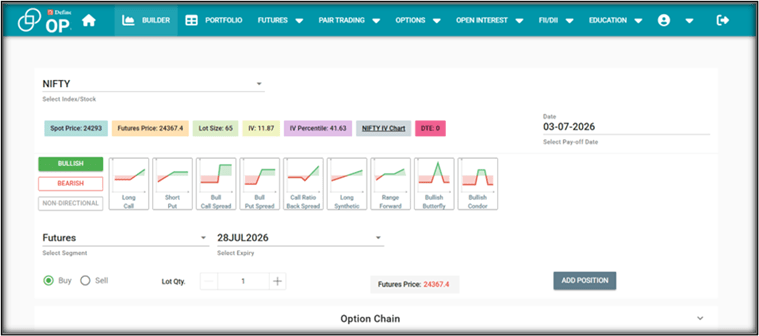
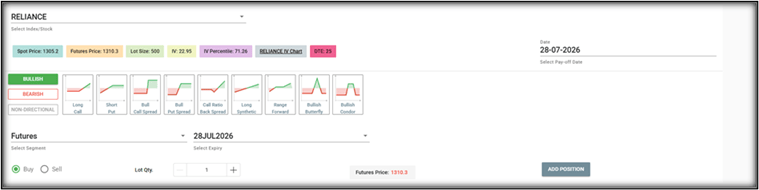
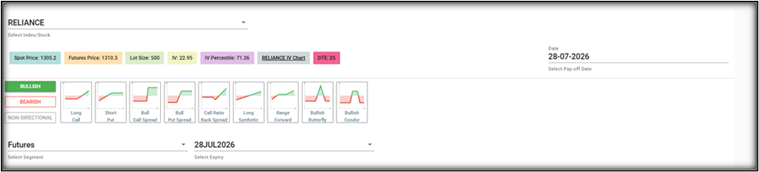
1.From the top navigation menu, click on Strategy Builder the below dashboard will appear .
2. In the search bar, select Reliance Industries Ltd. (RELIANCE) as the underlying stock.
3. Set the segment dropdown to Futures and choose your target Expiry Month (e.g., 28JUL2026).
4. Select your trade direction by checking the Buy or Sell radio button.
5. Set Your Quantity: Leave the Lot Qty. at 1 (which controls a bundle of 500 shares for Reliance).
6. Click the blue "ADD POSITION" button to register the trade simulation on the platform.
Analyze the Strategy Positions Dashboard (Left Side Panel)
4
Scroll down the webpage right below the configuration console.
A dynamic, interactive line chart will automatically appear.
If you chose Buy, you will see a diagonal line shooting straight up from left to right (representing unlimited profit as Reliance rises).
If you chose Sell, you will see a diagonal line sloping downward from left to right (representing profit as Reliance falls).
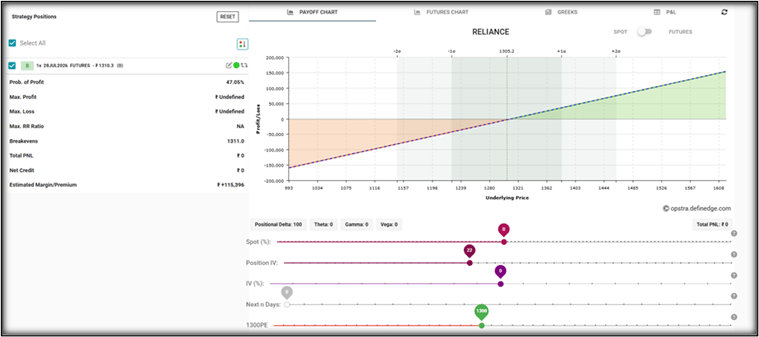
Active Position: Shows B 1x 28JUL2026 FUTURES active at an entry price of ₹1,310.30.
Max Profit & Max Loss: Marked as ₹ Undefined, demonstrating that futures carry uncapped financial outcomes on both ends.
Breakeven Point: Automatically plotted at 1311.0.
Estimated Margin/Premium: Shows ₹ +1,15,396, indicating the structural margin capital deposit required by the broker and exchange to hold the trade active.
Interpret the Interactive Payoff Chart
5
Look at the dynamic linear graph generated next to your metrics panel to understand your real-time risk boundaries:
The Shape: A straight diagonal line slicing from bottom-left to top-right.
Green Zone (Profit Area): Shaded green in the upper-right quadrant as prices rise towards ₹1,321, and beyond.
Red Zone (Loss Area): Shaded orange in the lower-left quadrant as prices plunge lower towards ₹1,280 and beyond.
Short Futures Position
6
The Strategy: The trader expects Reliance shares to fall sharply.
The Trade: Sell (short) 1 RELIANCE Futures contract.
Formula: Profit / Loss = Entry Price - Expiry Price
| Expiry Price of RELIANCE | Calculation (₹1,310.30 - Expiry Price) | Net Profit / Loss (₹ per share) |
|---|---|---|
| ₹1,200 | 1,310.30 - 1,200 | +₹110.30 (Profit) |
| ₹1,250 | 1,310.30 - 1,250 | +₹60.30 (Profit) |
| ₹1,310.30 | 1,310.30 - 1,310.30 | ₹0.00 (Break-Even) |
| ₹1,350 | 1,310.30 - 1,350 | -₹39.70 (Loss) |
| ₹1,400 | 1,310.30 - 1,400 | -₹89.70 (Loss) |
Analyze the Short Futures Strategy on Opstra Dashboard
a
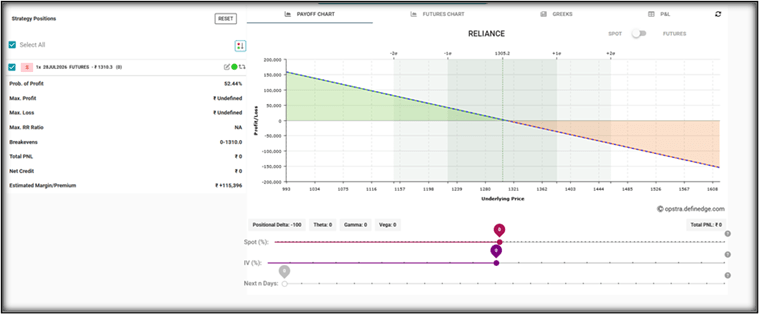
Once you click "Sell" and add the position, Opstra builds your live short-selling analysis board. Scroll down right below the trade setup console to inspect:
Active Position: You will see S 1x 28JUL2026 FUTURES active at an entry price of ₹1,310.30. The red S denotes a Sell (Short) position.
Max Profit & Max Loss: Notice that both fields are marked as ₹ Undefined. This visually proves to students that just like a long position, a short futures position carries theoretically unlimited risk if the stock price surges upwards against you.
Estimated Margin/Premium: It shows ₹ +1,15,396, This is the approximate margin amount that the trader must maintain in their trading account before selling one RELIANCE Futures contract.
Interpret the Short Futures Payoff Chart
b
Look at the interactive linear chart to see how the profit and loss behavior completely flips compared to the long position:
The Diagonal Line Pattern: Because this is a Short (Sell) Futures position, the chart features a straight diagonal line sloping downward from the top-left corner to the bottom-right corner.
The Green Zone (Profit Area on the Left): Observe the upper-left quadrant shaded in green. As the underlying stock price falls below your entry level (moving left towards ₹1,280, ₹1,239, ₹1,198, and lower), the diagonal line climbs higher into positive profit territory.
The Shaded Orange/Red Zone (Loss Area on the Right): Observe the lower-right quadrant shaded in orange. If the stock unexpectedly rallies past your entry point (moving right towards ₹1,321, ₹1,362, ₹1,403, and higher), the line plunges straight down into negative territory, visually confirming that short futures carry theoretically unlimited upside risk.
Long Call Option (Buying a Call)
7
The Strategy: The trader is bullish but wants to protect themselves against a stock market crash.
The Trade: Buy 1 RELIANCE Call Option with a Strike Price = ₹1310 by paying a upfront Premium = ₹30.35.
Formula: If Expiry > Strike: Profit/Loss = (Expiry Price - Strike Price) - Premium Paid
Formula: If Expiry <= Strike: Profit/Loss = -Premium Paid (Option expires worthless)
| Expiry Price of RELIANCE | Option Value at Expiry | Less Premium Paid | Net Profit / Loss (₹ per share) |
|---|---|---|---|
| ₹1,200 | ₹0 (Worthless) | -₹30.35 | -₹30.35 (Maximum Loss) |
| ₹1,250 | ₹0 (Worthless) | -₹30.35 | -₹30.35 (Maximum Loss) |
| ₹1,310 | ₹0 (Worthless) | -₹30.35 | -₹30.35 (Maximum Loss) |
| ₹1,340.35 | ₹30.35 | -₹30.35 | ₹0.00 (Break-Even Point) |
| ₹1,350 | ₹40.00 | -₹30.35 | +₹9.65 (Profit) |
| ₹1,400 | ₹90.00 | -₹30.35 | +₹59.65 (Profit) |
Configure and Add Your Long Call Position
a
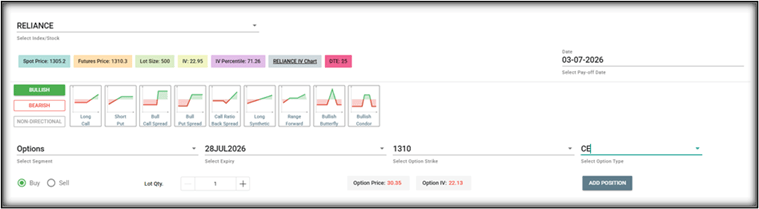
To simulate the bullish option strategy on the Opstra builder follow these configuration steps:
Select Segment: Change the first segment dropdown menu from Futures to Options.
Select Expiry: Ensure the next dropdown is set to the near-month contract, 28JUL2026.
Select Strike Price: Click the strike dropdown menu and select the 1310 strike price line.
Select Option Type: Choose CE (Call Option) from the final dropdown panel.
Set Direction & Quantity: Verify that the Buy button is selected and keep the Lot Qty. at 1 (controlling 500 shares).
Note: Notice that the system automatically captures a live benchmark Option Price (Premium) of 30.35, matching your setup parameters.
Click the blue "ADD POSITION" button to lock in the contract simulation.
Analyze the Long Call Strategy Dashboard
b
Scroll down the webpage right below the configuration layout to verify the simulated portfolio metrics shown below:
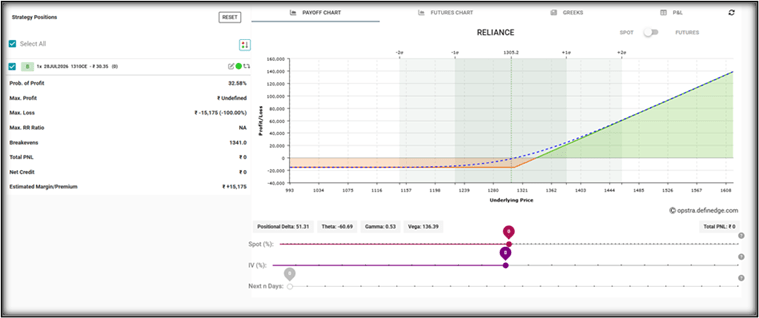
Active Position: You will see B 1x 28JUL2026 1310CE running at an entry premium of ₹30.35.
Max Profit: The dashboard displays ₹ Undefined. This visually validates that if Reliance rallies aggressively past your strike, your profit potential is mathematically unlimited.
Max Loss: Shows a fixed -₹15,175 (-100.00%). This represents the absolute maximum capital risk (). Unlike Futures, your loss is strictly capped even if the stock drops to zero.
Breakeven Point: The system identifies at 1341.0 ().
Estimated Margin/Premium: The box shows Shows ₹ +15,175. Remind students that option buyers pay only the fixed premium upfront; no structural exchange margin is blocked.
Interpret the Long Call Payoff Chart
c
Look at the chart curve generated on your Opstra panel in image evaluate the capped-risk mechanics of buying a call option:
The X-Axis (Horizontal — Underlying Price): Displays potential expiry prices for Reliance across a wide projection band from ₹993 to ₹1,608.
The Y-Axis (Vertical — Profit/Loss): Maps out the net financial results in rupees, scaling above and below the horizontal bold zero line.
The Flatline Floor Zone (Capped Risk on the Left): Look closely at the entire left-hand quadrant covering any price below the ₹1,310 strike. The chart line turns perfectly flat and remains locked inside the orange/red territory at exactly -₹15,175. This provides stark visual proof to students that even if Reliance crashes down toward ₹1,100 or ₹993, the buyer's losses completely stop growing.
The Turn Point: The chart line bends upward precisely at the ₹1,310 strike price landmark, charting the point where the option contract begins to build intrinsic value.
The Green Zone (Linear Profit on the Right): As the stock price rallies past your precise break-even line of ₹1,340.35 (moving right towards ₹1,362, ₹1,403, and up to ₹1,608), the payoff curve breaches the zero line, turns bright green, and shoots diagonally straight upward. This visualizes that once the upfront premium is covered, your profit potential scales dynamically alongside the rising stock price.
Long Put Option (Buying a Put)
8
The Strategy: The trader is bearish and expects Reliance to fall, but wants fixed, limited risk.
The Trade: Buy 1 RELIANCE Put Option with a Strike Price = ₹1,310 by paying an upfront Premium = ₹30.25.
Formula: If Expiry < Strike: Profit/Loss = (Strike Price - Expiry Price) - Premium Paid
Formula: If Expiry >= Strike: Profit/Loss = -Premium Paid (Option expires worthless)
| Expiry Price of RELIANCE | Option Value at Expiry | Less Premium Paid | Net Profit / Loss (₹ per share) |
|---|---|---|---|
| ₹1,200 | ₹110.00 | -₹30.25 | +₹79.75 (Profit) |
| ₹1,250 | ₹60.00 | -₹30.25 | +₹29.75 (Profit) |
| ₹1,279.75 | ₹30.25 | -₹30.25 | ₹0.00 (Break-Even Point) |
| ₹1,310 | ₹0 (Worthless) | -₹30.25 | -₹30.25 (Maximum Loss) |
| ₹1,350 | ₹0 (Worthless) | -₹30.25 | -₹30.25 (Maximum Loss) |
| ₹1,400 | ₹0 (Worthless) | -₹30.25 | -₹30.25 (Maximum Loss) |
Observation: If Reliance drops sharply, the Put buyer earns substantial profits. If the stock rallies unexpectedly, the maximum possible loss is strictly limited to the ₹30.25 premium.
Configure the Long Put Position on the Console
a
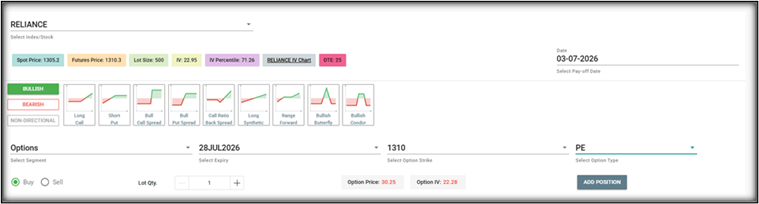
To simulate a protective bearish option strategy using the parameters shown in image below, follow these configuration steps:
Select Segment: Verify that the first segment dropdown menu is set to Options.
Select Expiry: Ensure the contract dropdown is set to the near-month expiry, 28JUL2026.
Select Strike Price: Click the strike dropdown menu and select the 1310 strike price line.
Select Option Type: Choose PE (Put Option) from the final dropdown panel.
Set Direction & Quantity: Verify that the Buy button is selected
6. Lot Qty. at 1 (controlling the standard bundle of 500 shares).
Note: Notice that the system captures a live benchmark Option Price (Premium) of 30.25, matching your initial lab setup.
7. Click the blue "ADD POSITION" button to lock in this simulation on the platform.
Analyze the Long Put Strategy Dashboard
b
Scroll down the webpage right below the configuration console to verify the simulated portfolio metrics shown below:
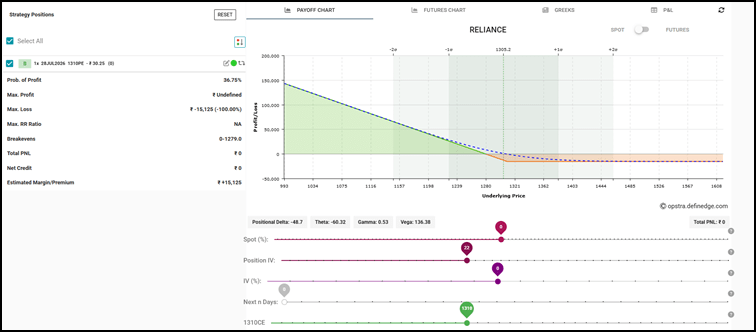
Active Position: You will see B 1x 28JUL2026 1310PE running at an entry premium of ₹30.25.
Max Profit: The dashboard displays ₹ Undefined. This reminds students that if Reliance experiences a heavy drop toward zero, the option captures massive, cascading returns.
Max Loss: Shows a fixed capped value of -₹15,125 (-100.00%) (). Even if the stock rallies unexpectedly to infinity, the loss is strictly limited to this upfront premium.
Breakevens: Plotted at 0-1279.0, meaning your profitable zone begins once the stock drops below ₹1,279.75 ().
Estimated Margin/Premium: Shows ₹ +15,125, confirming no margin is required for option buyers.
Interpret the Long Put Payoff Diagram (Right Graphic)
c
Look at the mirrored asymmetrical chart curve generated next to your dashboard in image to visually evaluate the downside protection structure:
The X-Axis (Horizontal — Underlying Price): Displays potential expiry prices for Reliance across a wide projection band from ₹993 to ₹1,608.
The Y-Axis (Vertical — Profit/Loss): Maps out the net financial results in rupees, scaling above and below the horizontal bold zero line.
The Flatline Floor Zone (Capped Risk on the Right): Look closely at the entire right-hand quadrant covering any price above the ₹1,310 strike. The chart line turns perfectly flat and remains locked inside the orange/red territory at exactly -₹15,125. This provides visual proof that even if Reliance rallies unexpectedly to ₹1,400, ₹1,500, or higher, the buyer's losses are strictly capped and will never exceed the upfront premium paid.
The Turn Point: The chart line bends dynamically precisely at the ₹1,310 strike price landmark, mapping out the threshold where the put option begins to accumulate intrinsic value.
The Green Zone (Linear Profit on the Left): As the stock price drops below your precise break-even line of ₹1,279.75 (moving left towards ₹1,239, ₹1,198, and lower), the payoff curve breaches the zero line, turns bright green, and shoots diagonally straight upward. This visualizes that a put option converts sharp market declines into substantial, expanding profits.
Compare Payoff Structures
9
Analyze the risk, reward, and market outlook overview for your final analytical client summary:
| Derivative Position | Maximum Profit | Maximum Loss | Suitable Market View |
|---|---|---|---|
| Long Futures | Unlimited (as stock rises) | Unlimited (as stock falls to zero) | Aggressively Bullish |
| Short Futures | Limited to entry price (if stock falls to zero) | Unlimited (as stock rises) | Aggressively Bearish |
| Long Call Option | Unlimited | Limited to Premium Paid | Moderately to Strongly Bullish (with downside protection) |
| Long Put Option | Substantial (Strike minus Premium) | Limited to Premium Paid | Moderately to Strongly Bearish (with upside protection) |
| Derivative Position | Maximum Profit | Maximum Loss | Suitable Market View |
|---|---|---|---|
| Short Call Option | Limited to Premium Received | Unlimited | Neutral to Bearish (expecting prices to stay below strike) |
| Short Put Option | Limited to Premium Received | Substantial (if stock crashes) | Neutral to Bullish (expecting prices to stay above strike) |
Activity
Student Task: F&O Dashboard & Payoff Analysis
Instructions
Open your Opstra Strategy Builder tool and search for HDFC Bank Ltd. (HDFCBANK) using the nearest monthly expiry.
Record the live baseline data in the header box below.
| Strategy & Trade Setup | Capital Required (Margin / Premium) | Max Profit (₹) | Max Loss (₹) | Breakeven Point (₹) |
|---|---|---|---|---|
| 1. Long Futures • Action: Buy 1 Lot • Entry Price: ₹ ___________ | Margin: ₹ ___________ | ₹ ___________ | ₹ ___________ | ₹ ___________ |
| Strategy & Trade Setup | Capital Required (Margin / Premium) | Max Profit (₹) | Max Loss (₹) | Breakeven Point (₹) |
|---|---|---|---|---|
| 2. Short Futures • Action: Sell 1 Lot • Entry Price: ₹ ___________ | Margin: ₹ ___________ | ₹ ___________ | ₹ ___________ | ₹ ___________ |
| Strategy & Trade Setup | Capital Required (Margin / Premium) | Max Profit (₹) | Max Loss (₹) | Breakeven Point (₹) |
|---|---|---|---|---|
| 3. Long Call (CE) Action: Buy 1 Lot ATM CE Strike: ________ Premium: ₹ ___________ | Premium Paid: ₹ ___________ | ₹ ___________ | ₹ ___________ | ₹ ___________ |
| Strategy & Trade Setup | Capital Required (Margin / Premium) | Max Profit (₹) | Max Loss (₹) | Breakeven Point (₹) |
|---|---|---|---|---|
| 4. Long Put (PE) Action: Buy 1 Lot ATM PE Strike: ________ Premium: ₹ ___________ | Premium Paid: ₹ ___________ | ₹ ___________ | ₹ ___________ | ₹ ___________ |
Congratulations on completing this lab!
You used the Opstra Strategy Builder to analyze the risk, profit, loss, breakeven point, and margin requirements of different Futures and Options strategies. You compared the payoff structures of Long Futures, Short Futures, Long Call, and Long Put positions and understood how market movements influence each strategy. These concepts provide a strong foundation for analyzing derivatives and managing trading risk.
Checkpoint
By Content ITV