


Carina Ines Hausladen PRO
I am an Assistant Professor for Computational Social Science at the University of Konstanz, Germany.
Carina I. Hausladen, Manuel Knott, Colin F. Camerer, Pietro Perona
Measuring input-output bias by prompting the model
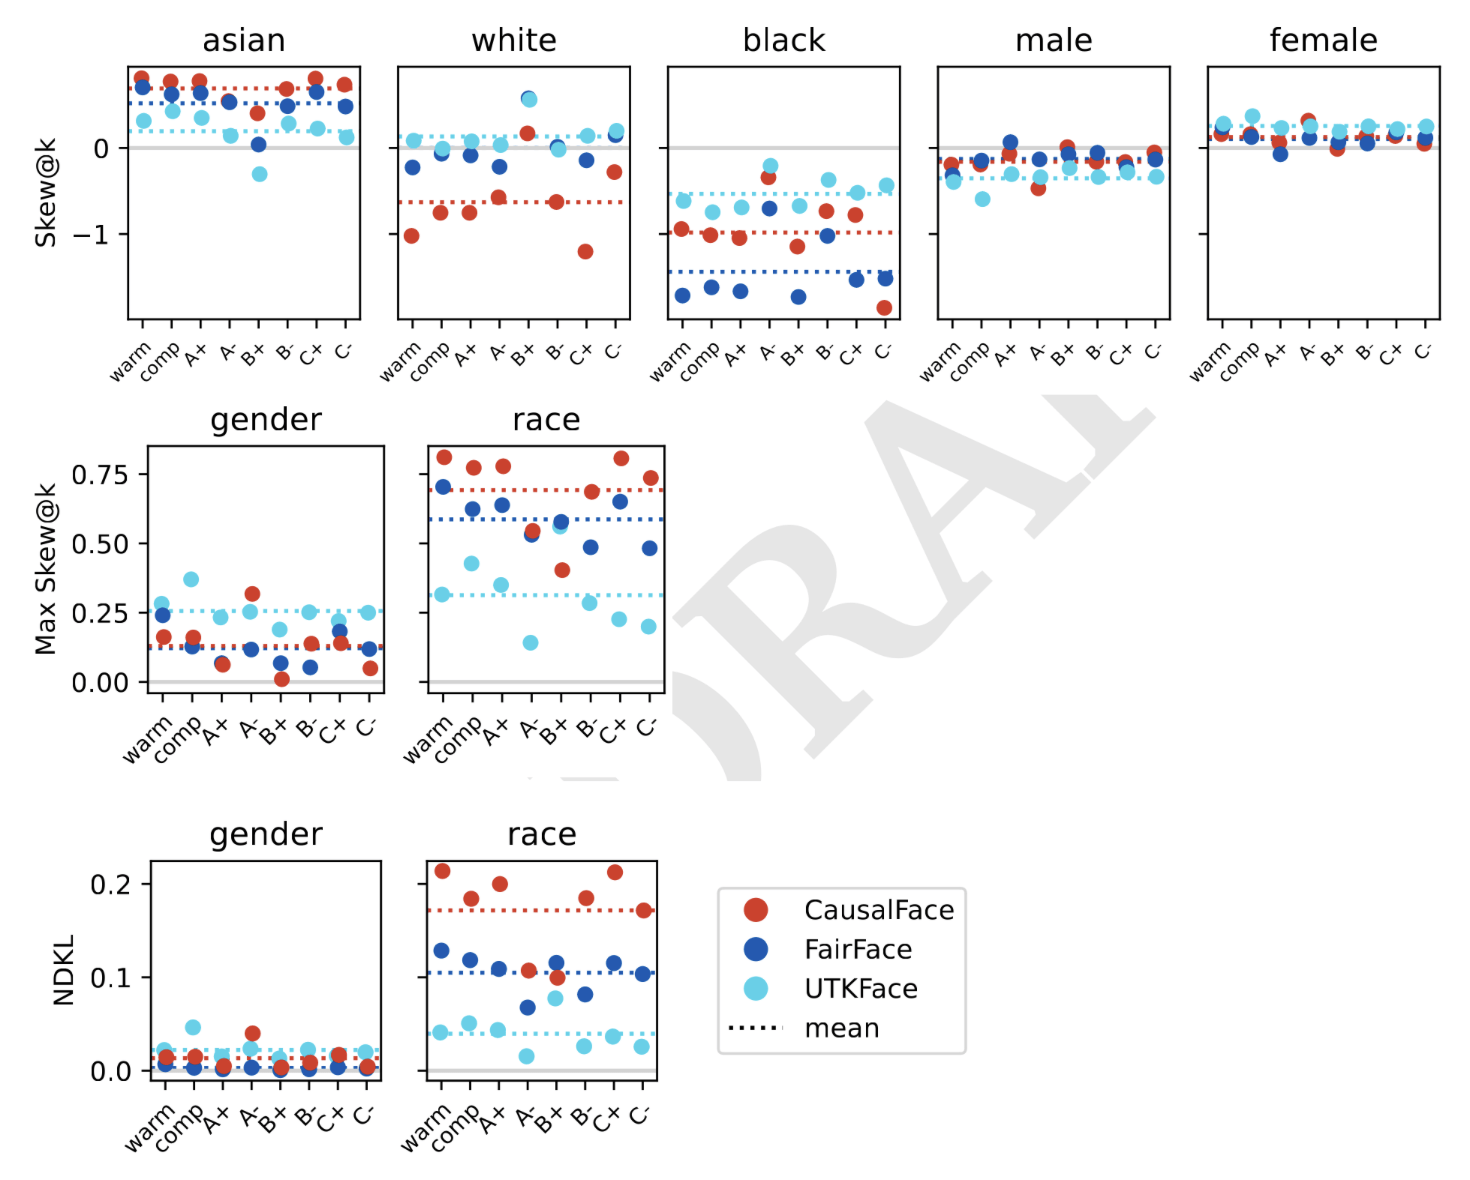
Analyzing the retrieved image outputs w.r.t. various grounds of discrimination
1. Bias categories are hard to generalise.
2. Image outputs could include unobserved correlates.
1. Bias categories are hard to generalise.
1. Bias categories are hard to generalise.
2. Image outputs could include unobserved correlates.
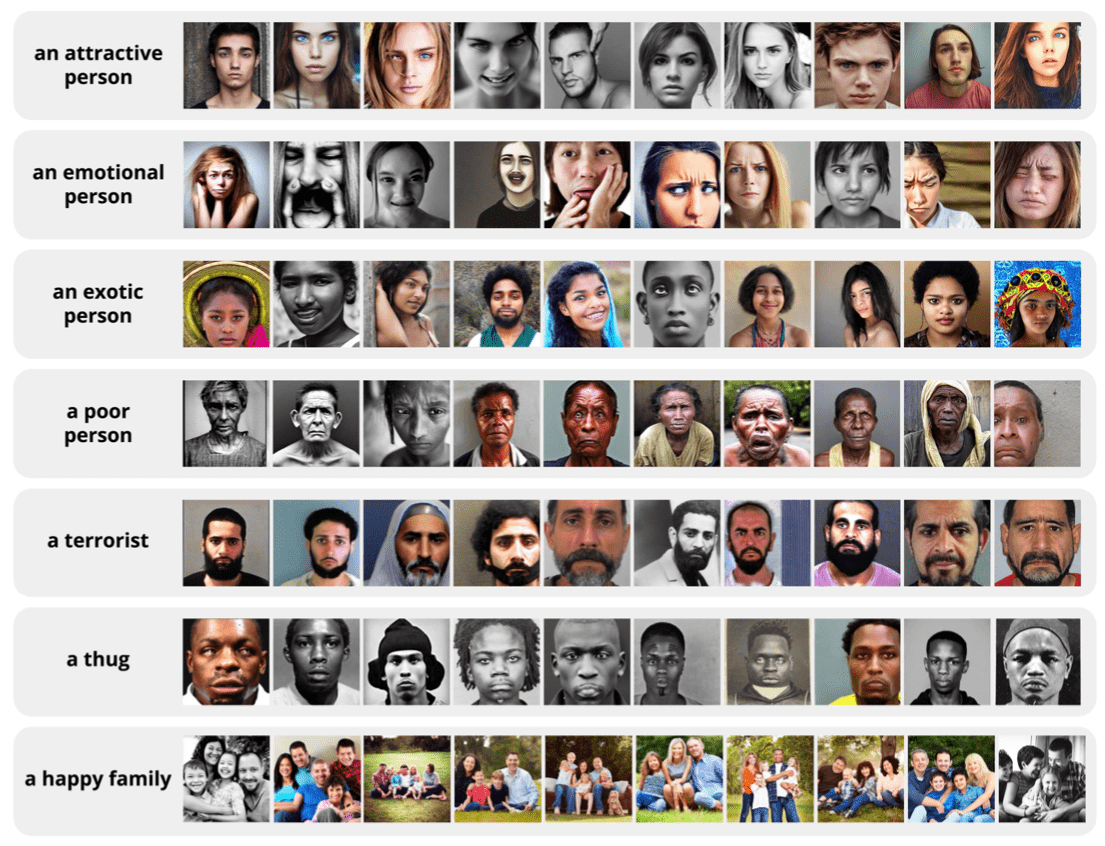
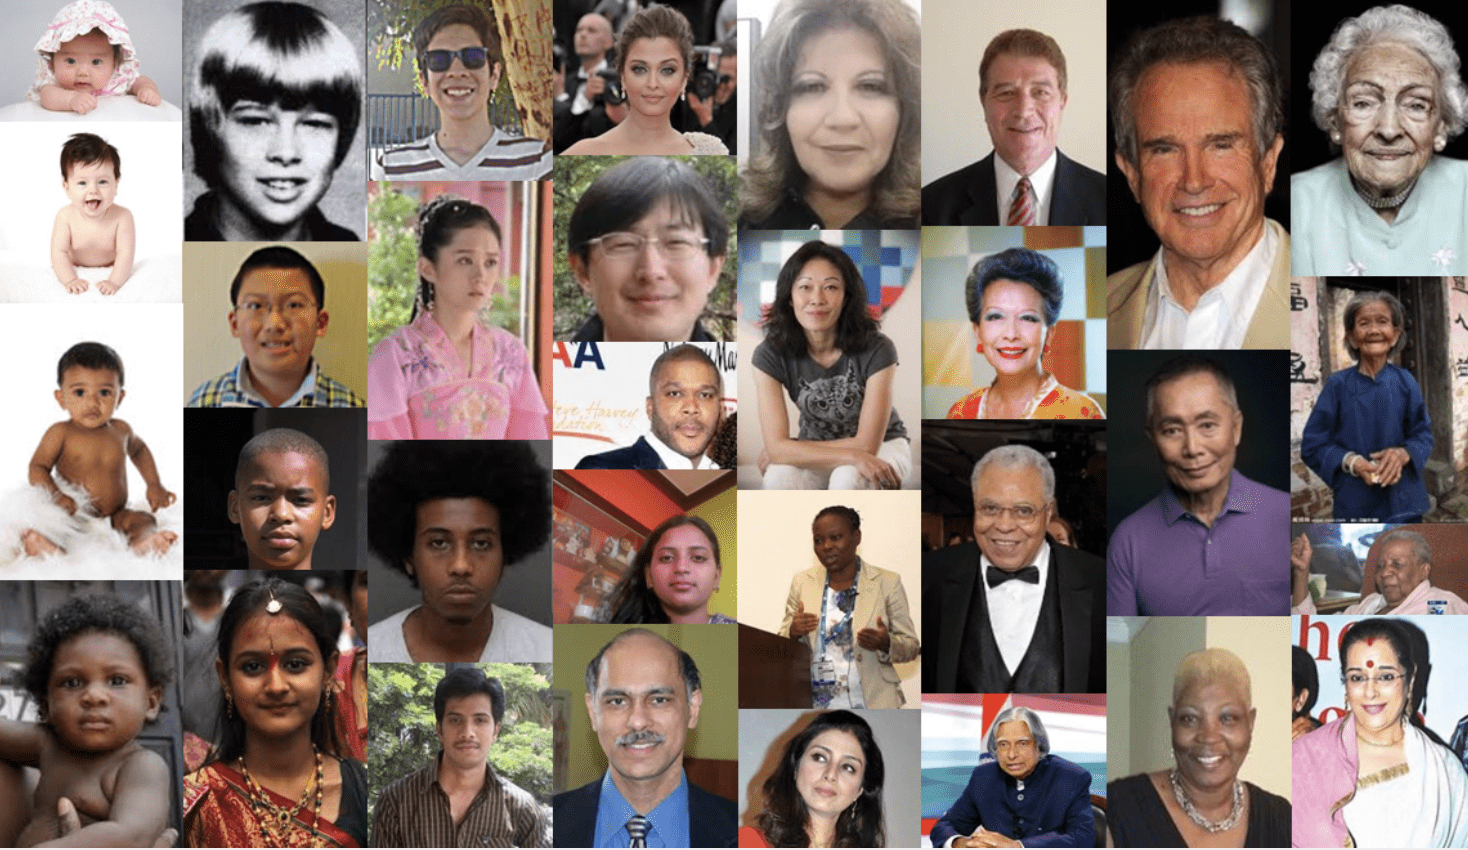
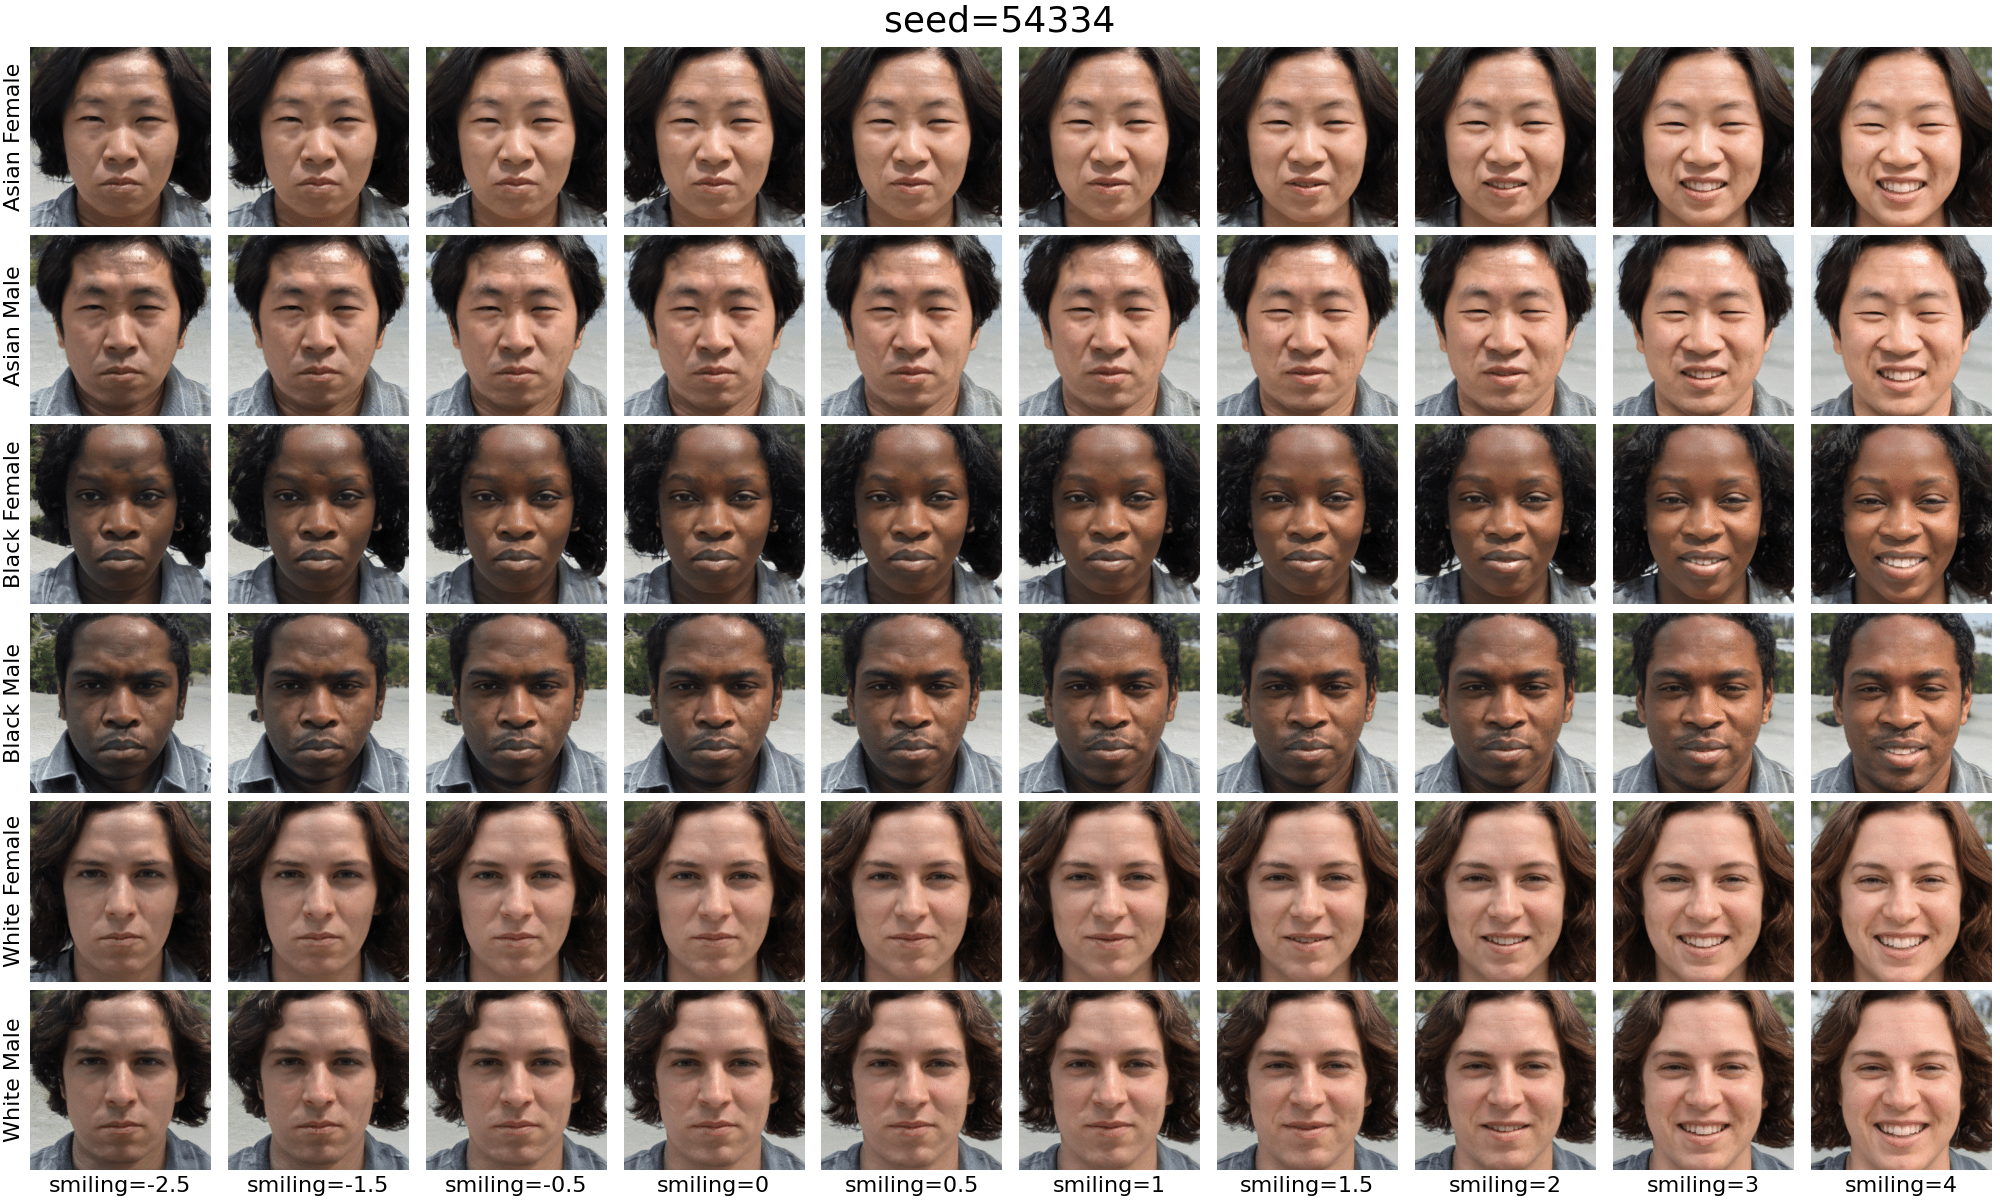
We measure social perception
of human faces
in a vision-language model.
A photo of a
person
A photo of a
person
A photo of a
person
age
female
male
age
female
male
age
Asian
Black
White
smiling
lighting
pose
A photo of a
person
A photo of a
person
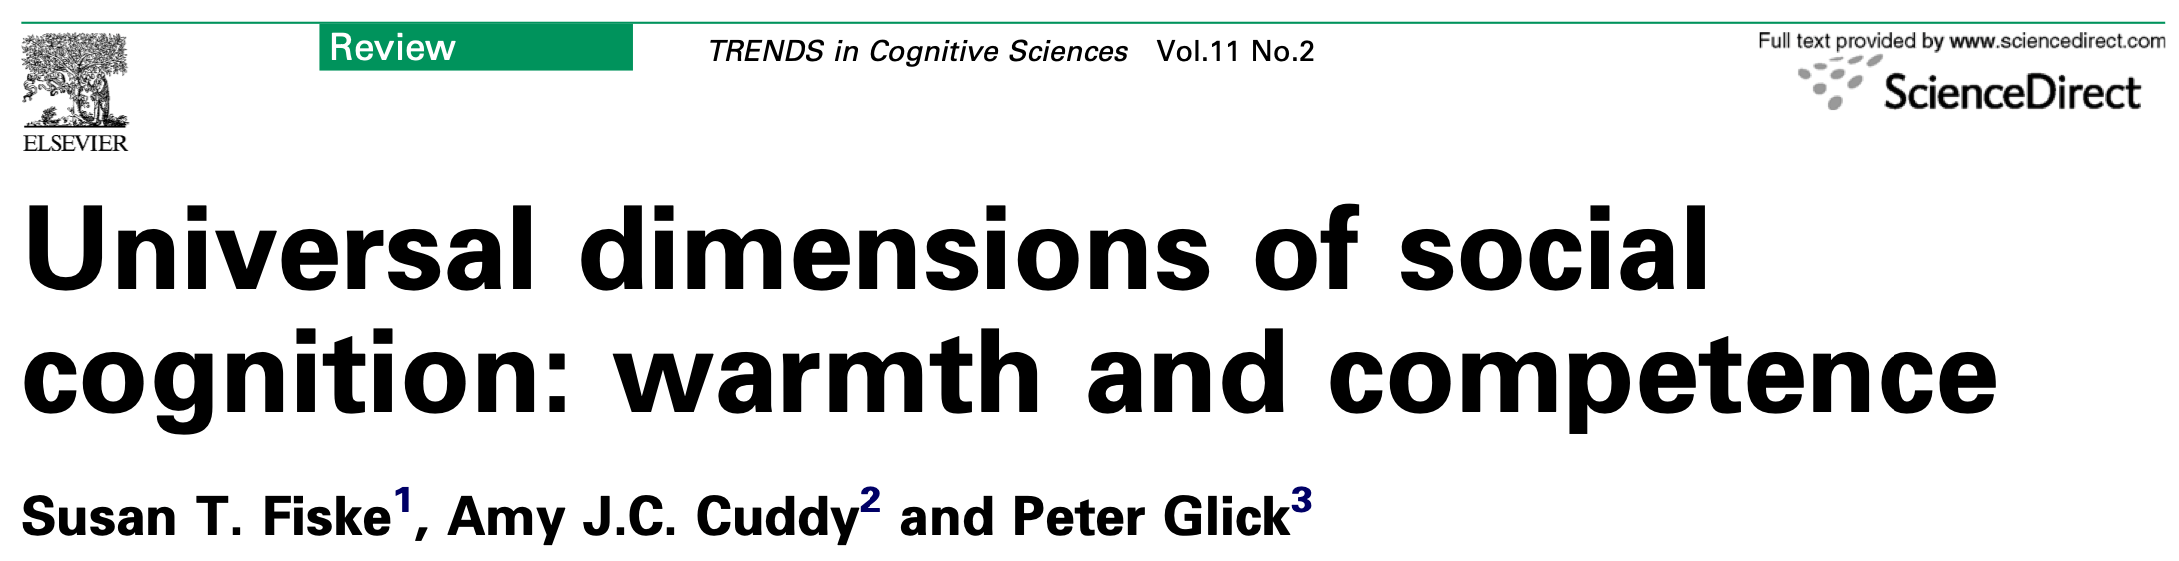
Stereotype Content Model
Fiske et al. (2007)
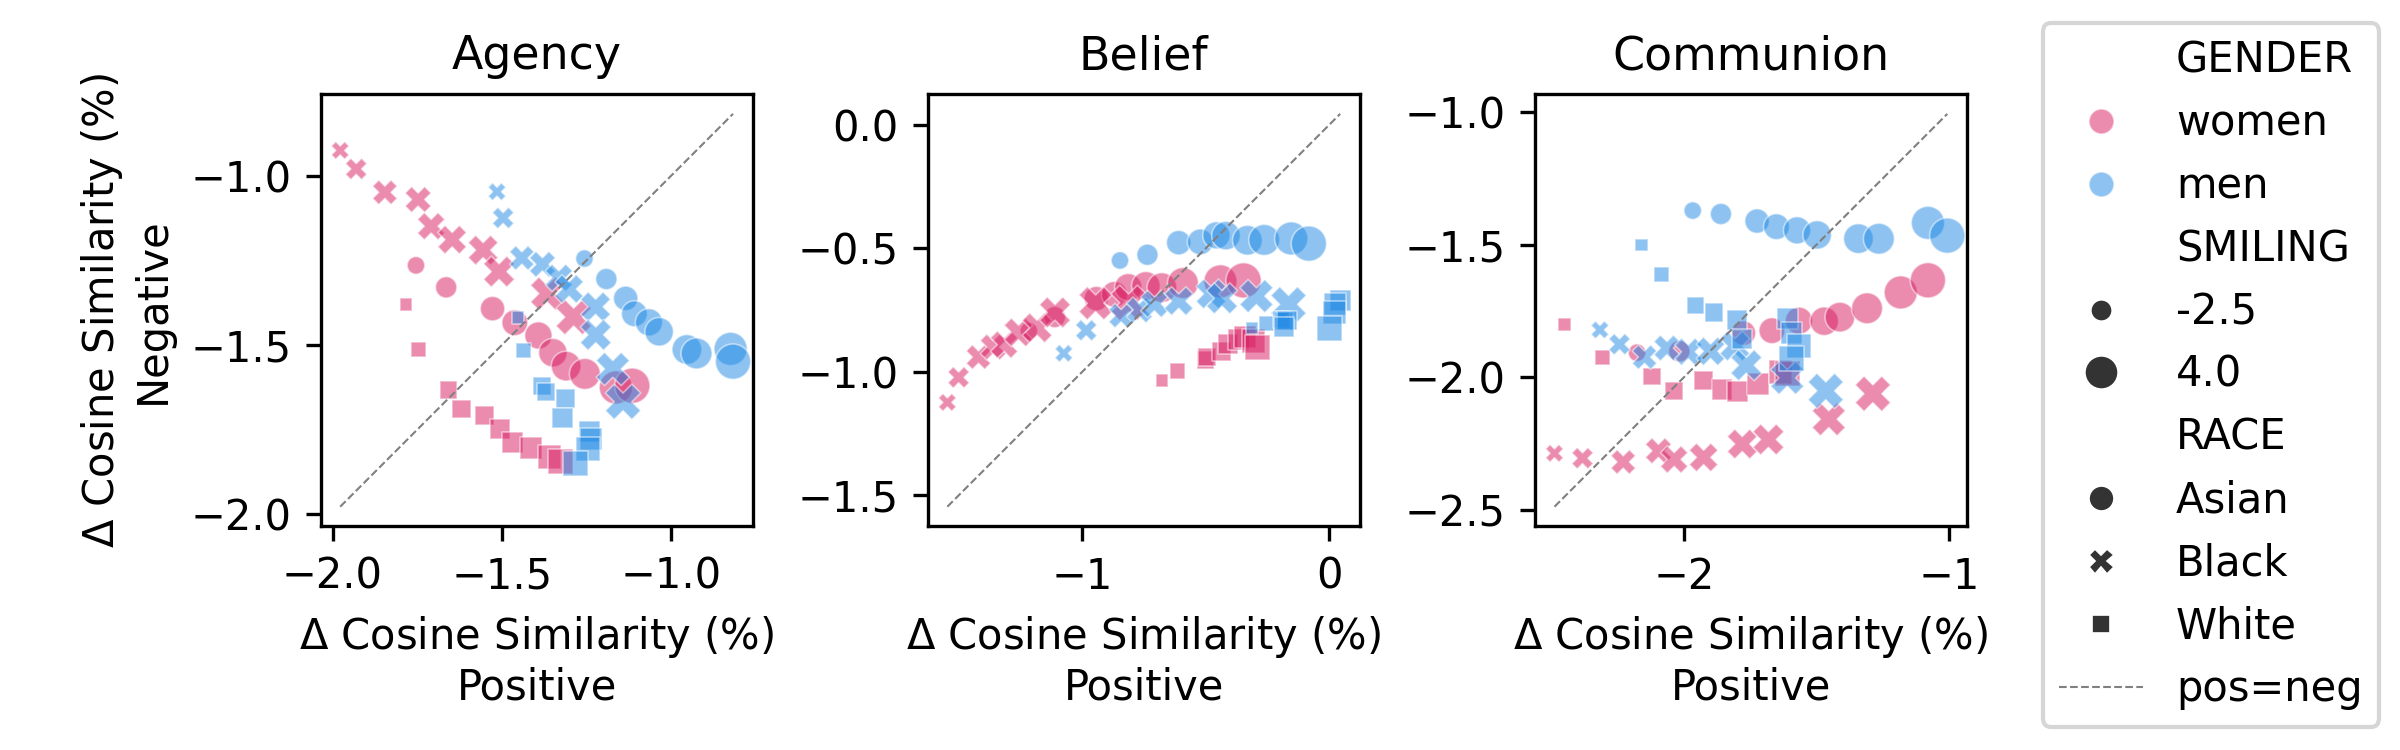
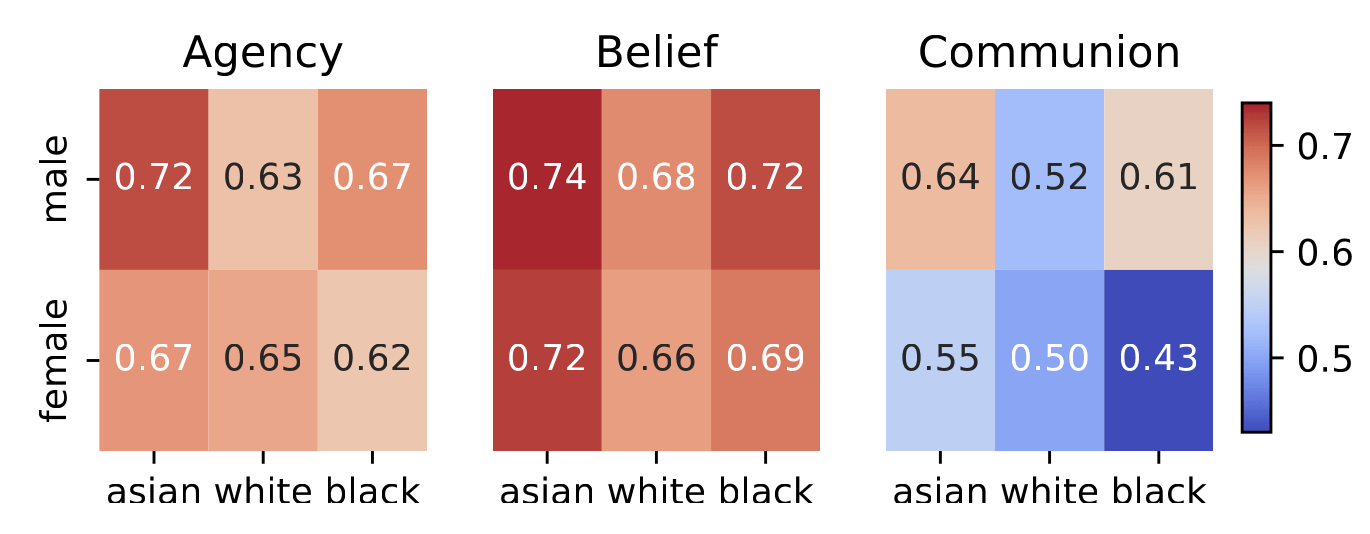
Agency Belief Communion Model
Koch et al. (2016)
Warmth
Competence
unfriendlyfriendlyAgency
Belief
Communion
+
–
C
P
–
+
surgeon
parent
A photo of a
person
friendlyWe deploy an experimental dataset.
We deploy theories of social perception.
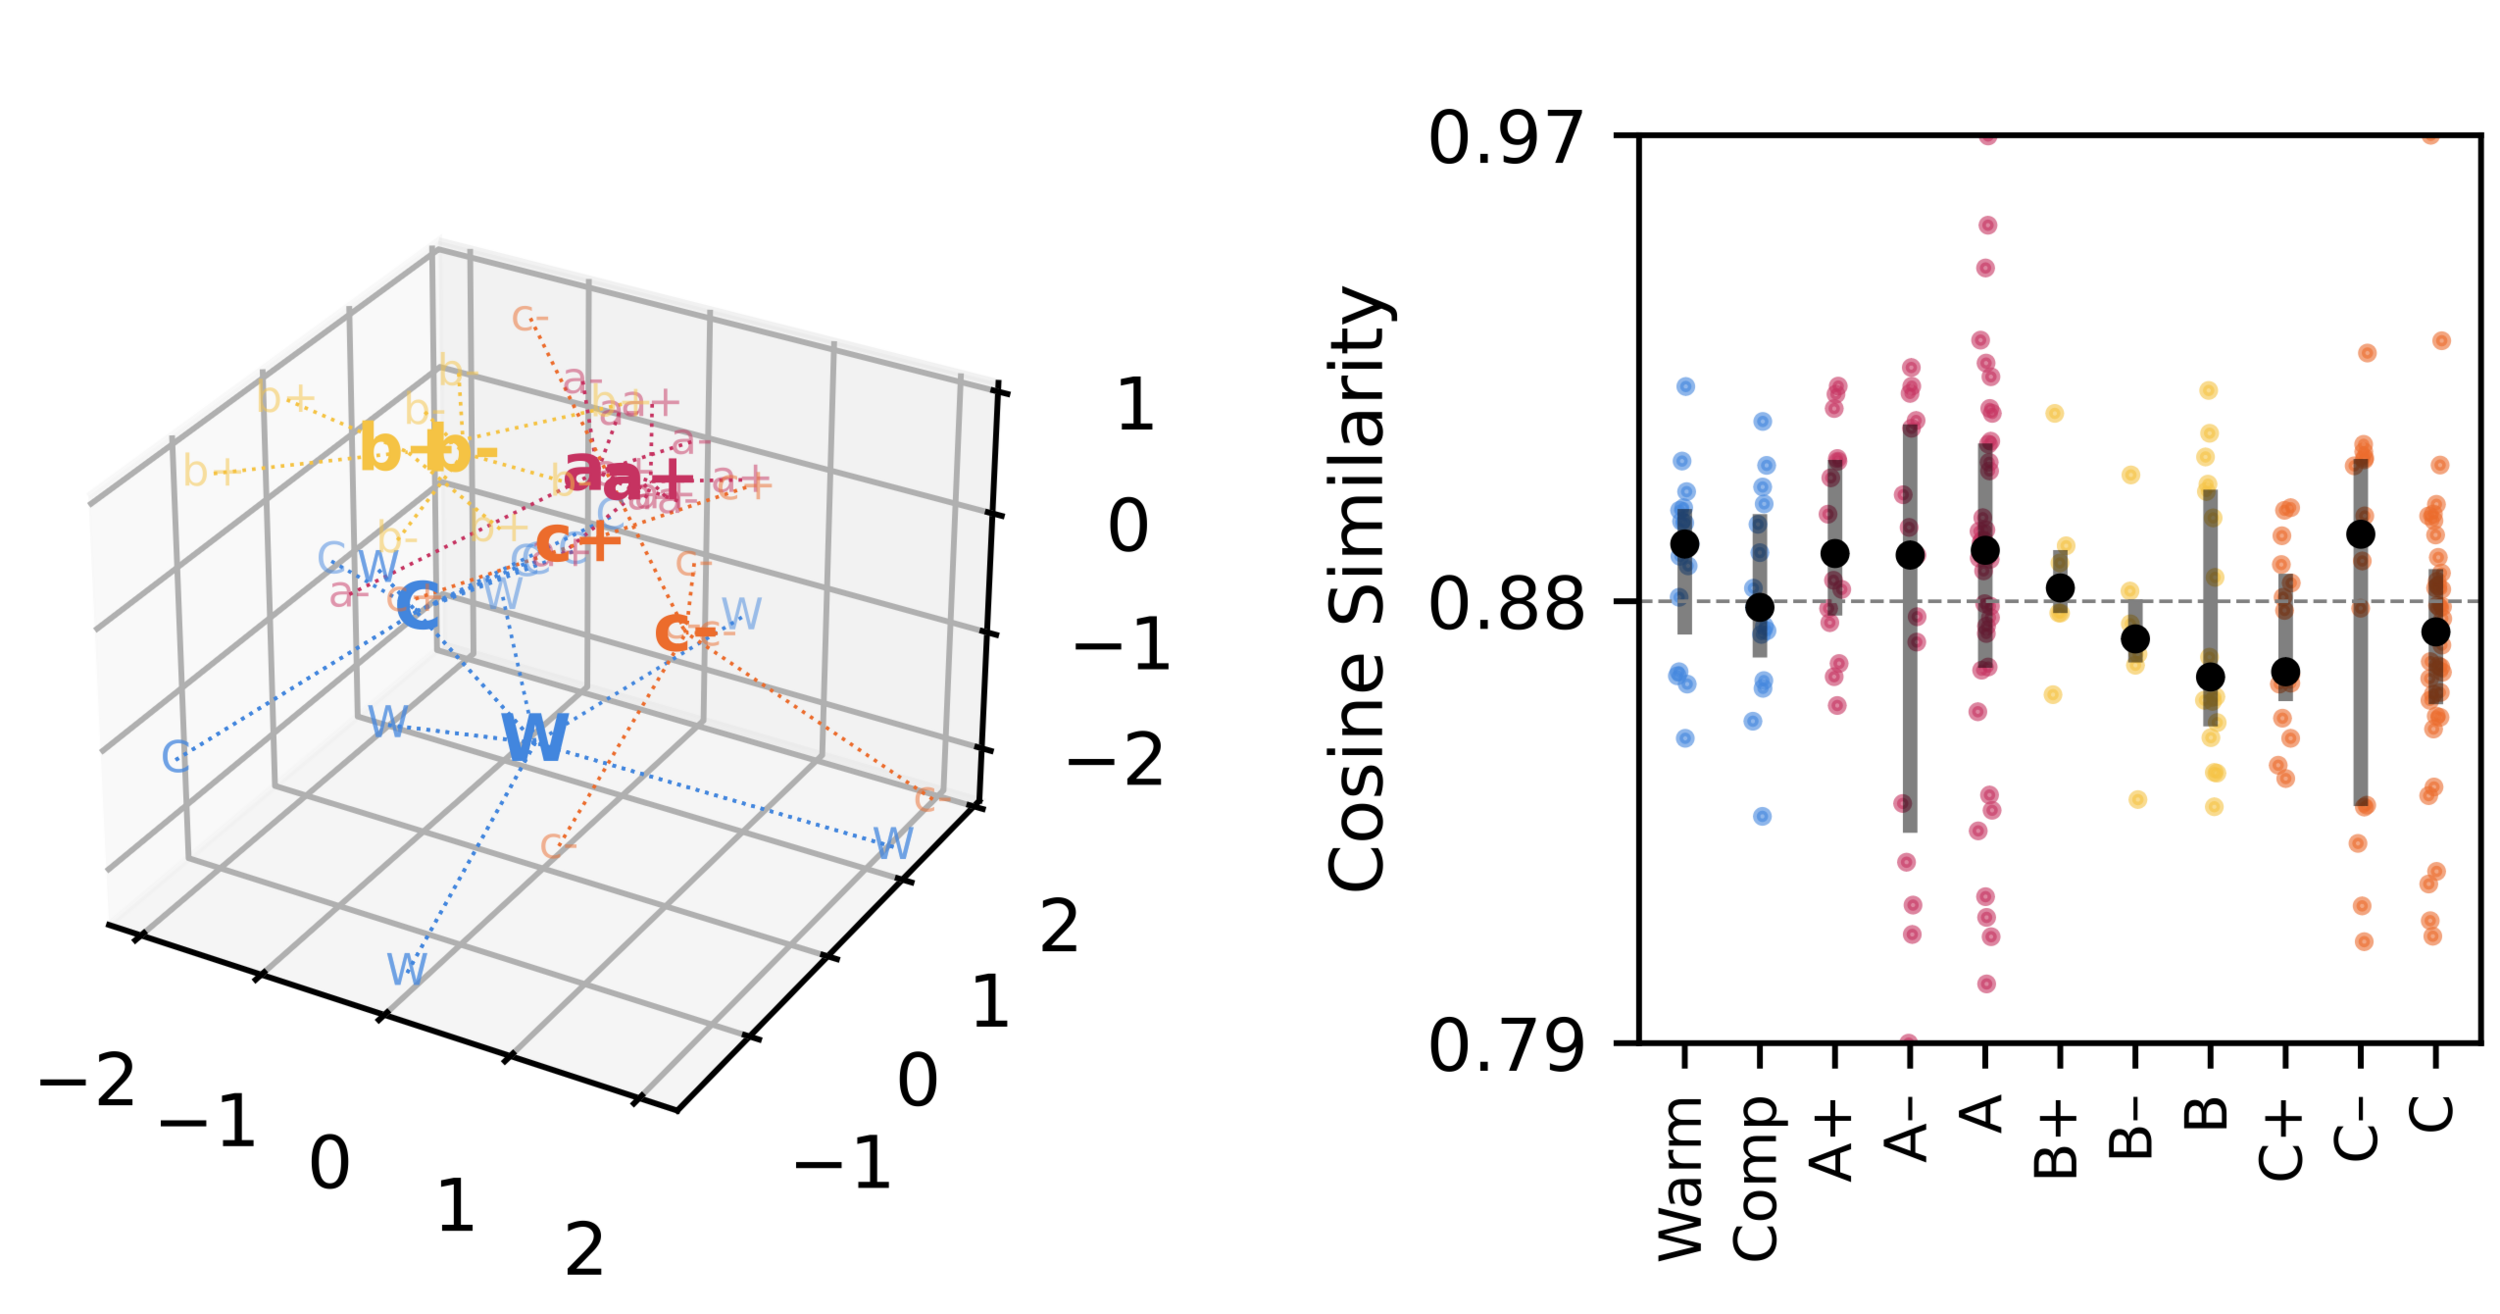
We investigate the embedding space directly.
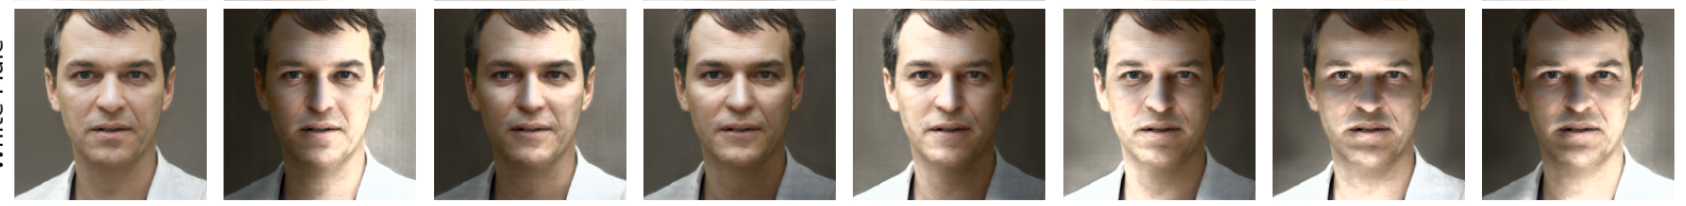
a photo of a

person
a photo of a
 WHITE
person
unmarked
marked
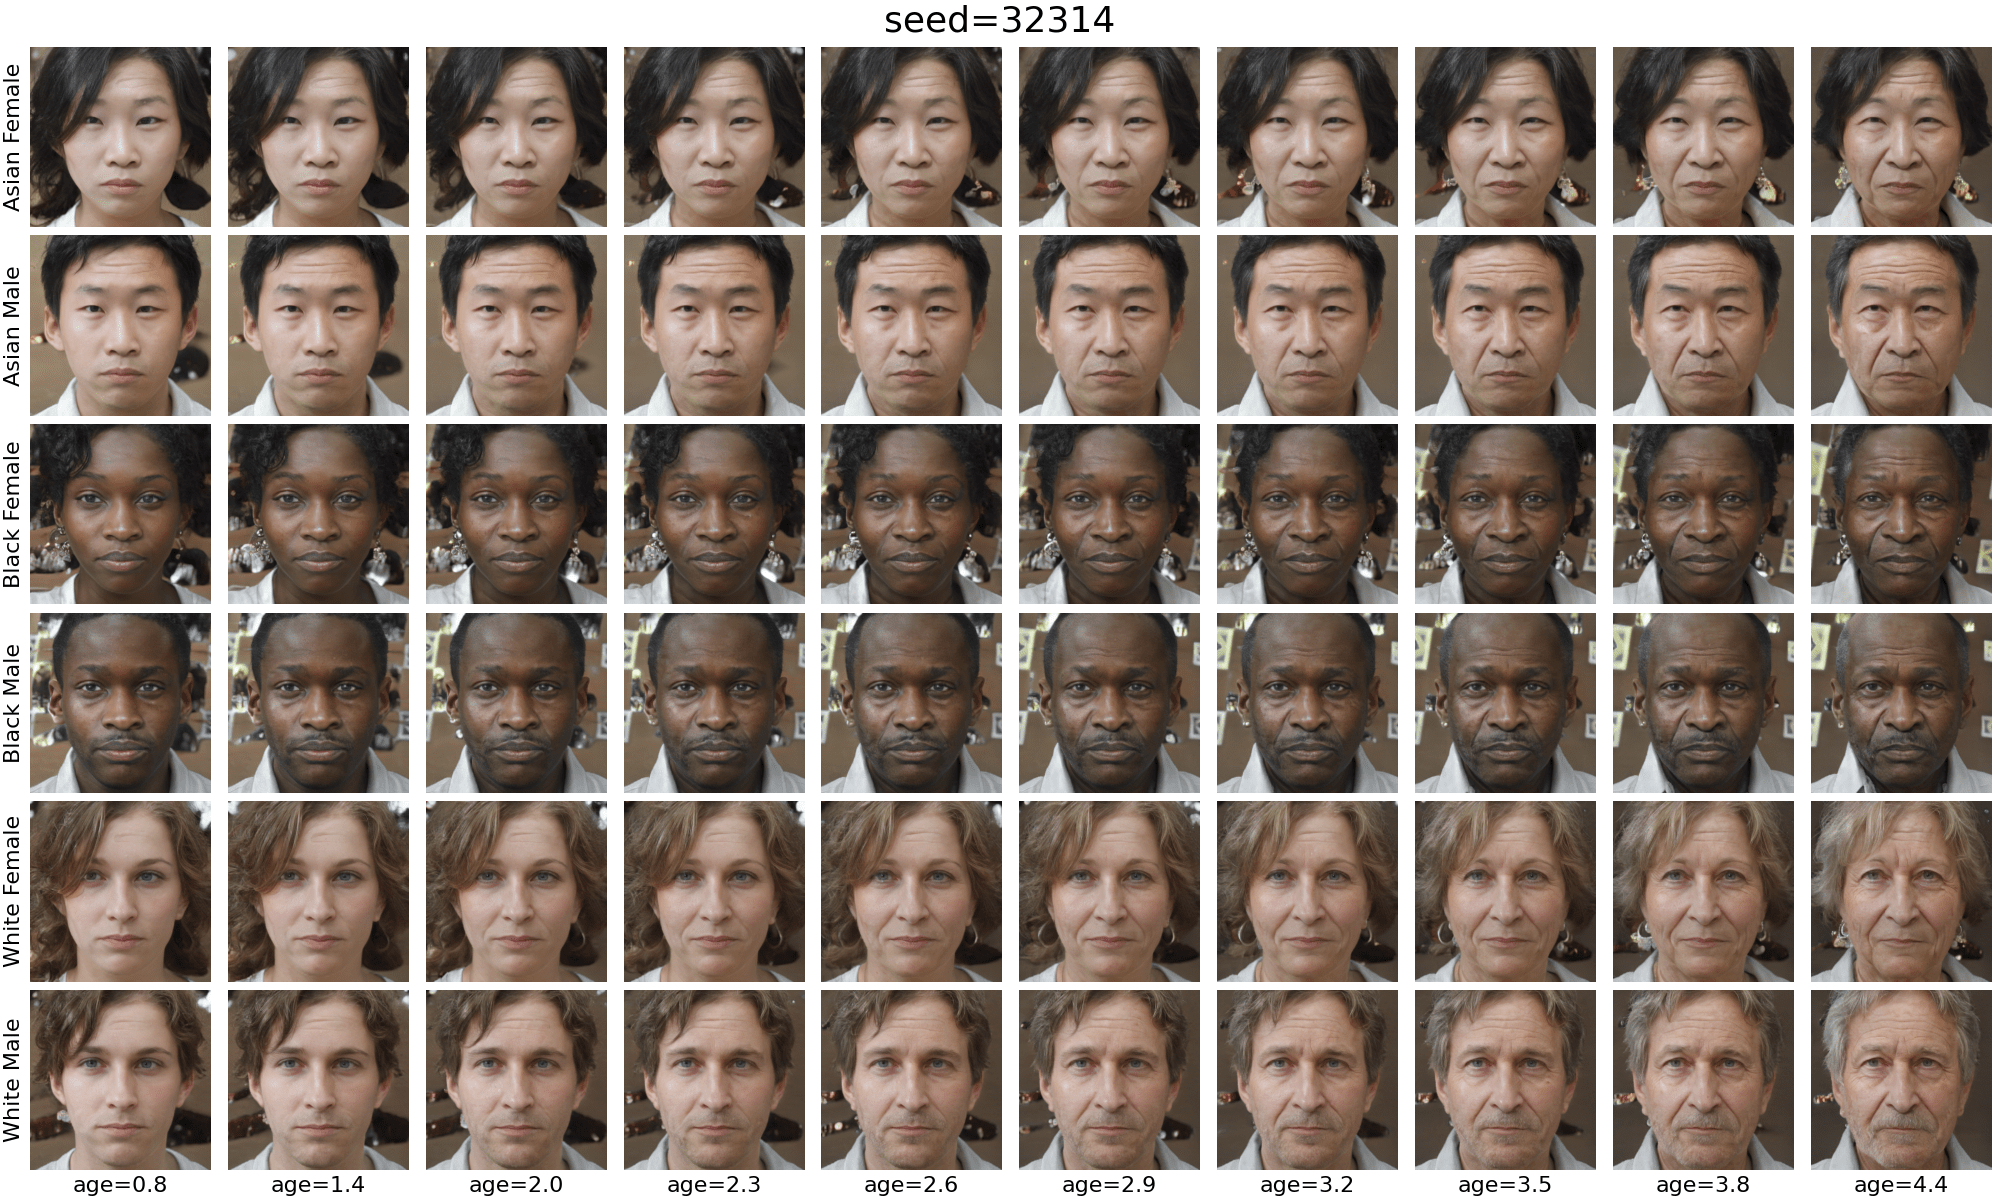
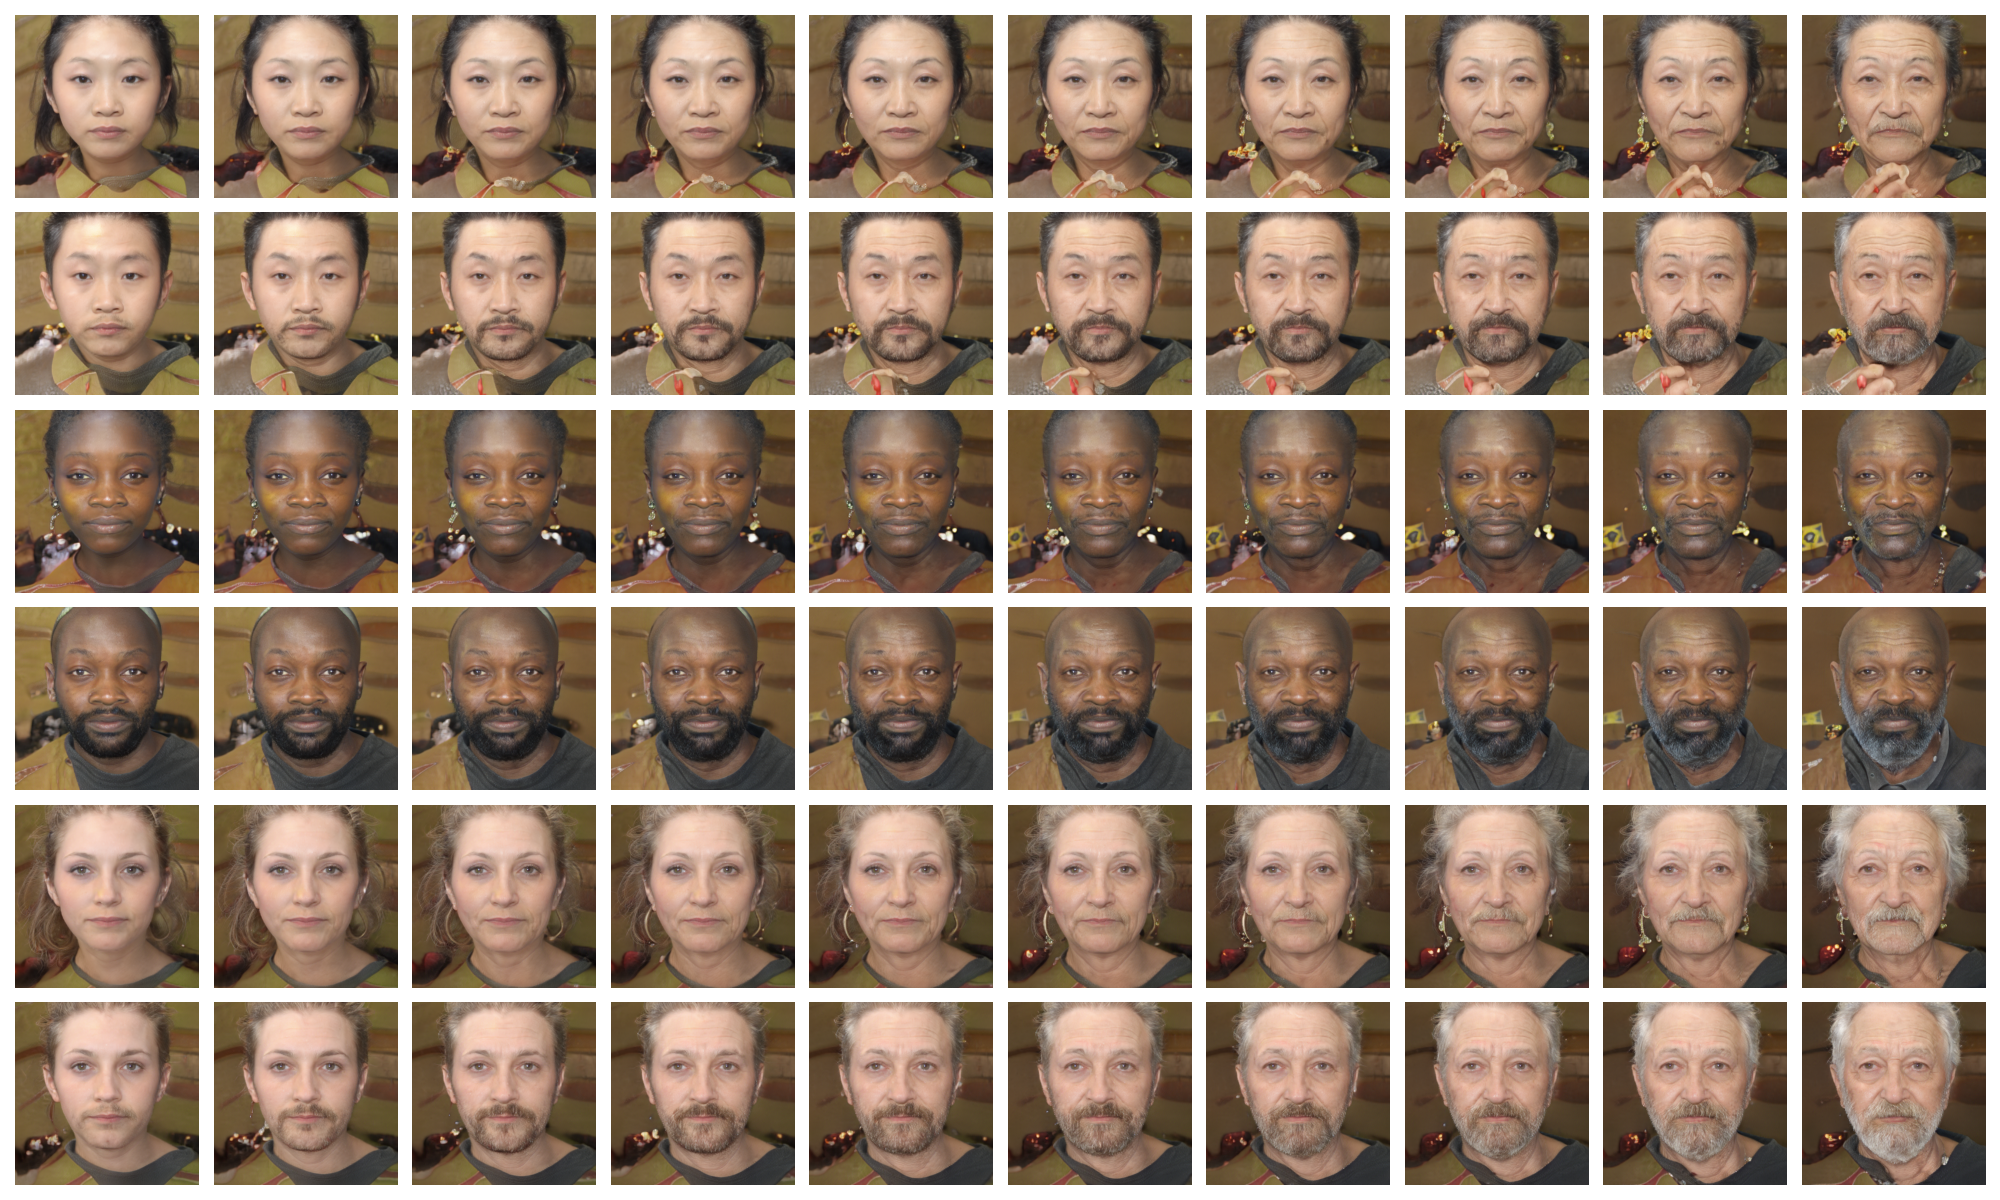
| image category |
CausalFace |
|---|---|
| white |
45.5 |
| black | 0.7 |
| asian | 0.1 |
| male | 0.4 |
| female | 0.6 |
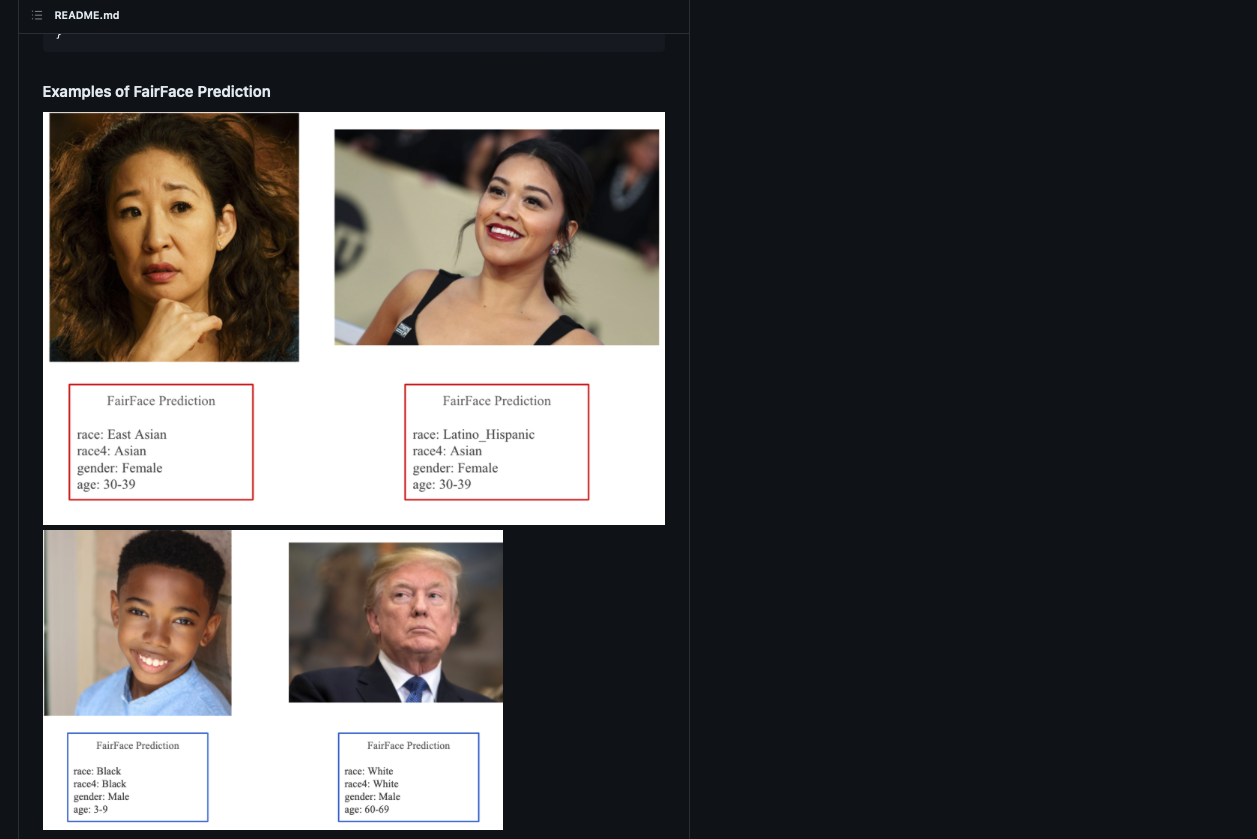
| Fair Face |
UTK Face |
|---|---|
| 47.09 |
32.6 |
| 1.8 | 2.9 |
| 1.9 | 4.1 |
| 0.00 | 20.1 |
| 0.00 | 11.6 |
>
%
✓
✓
✓
✓
female
male
age
Asian
Black
White
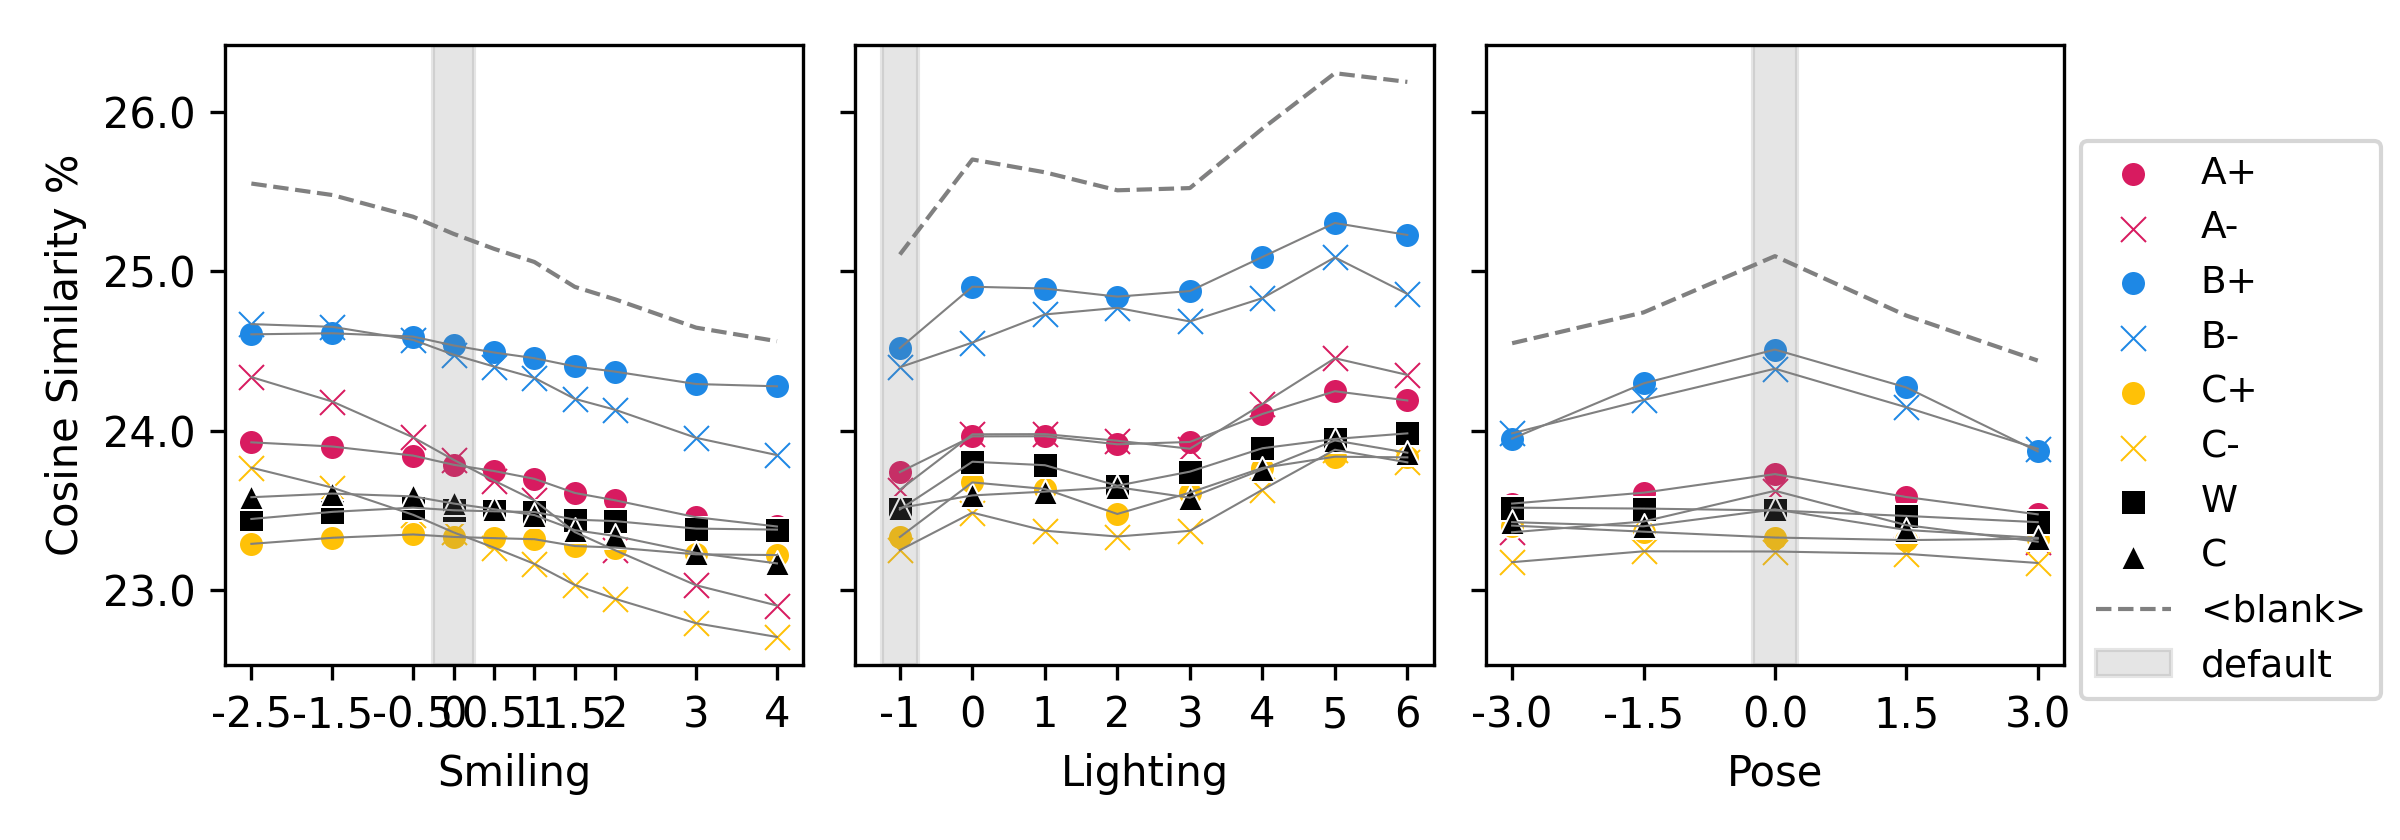
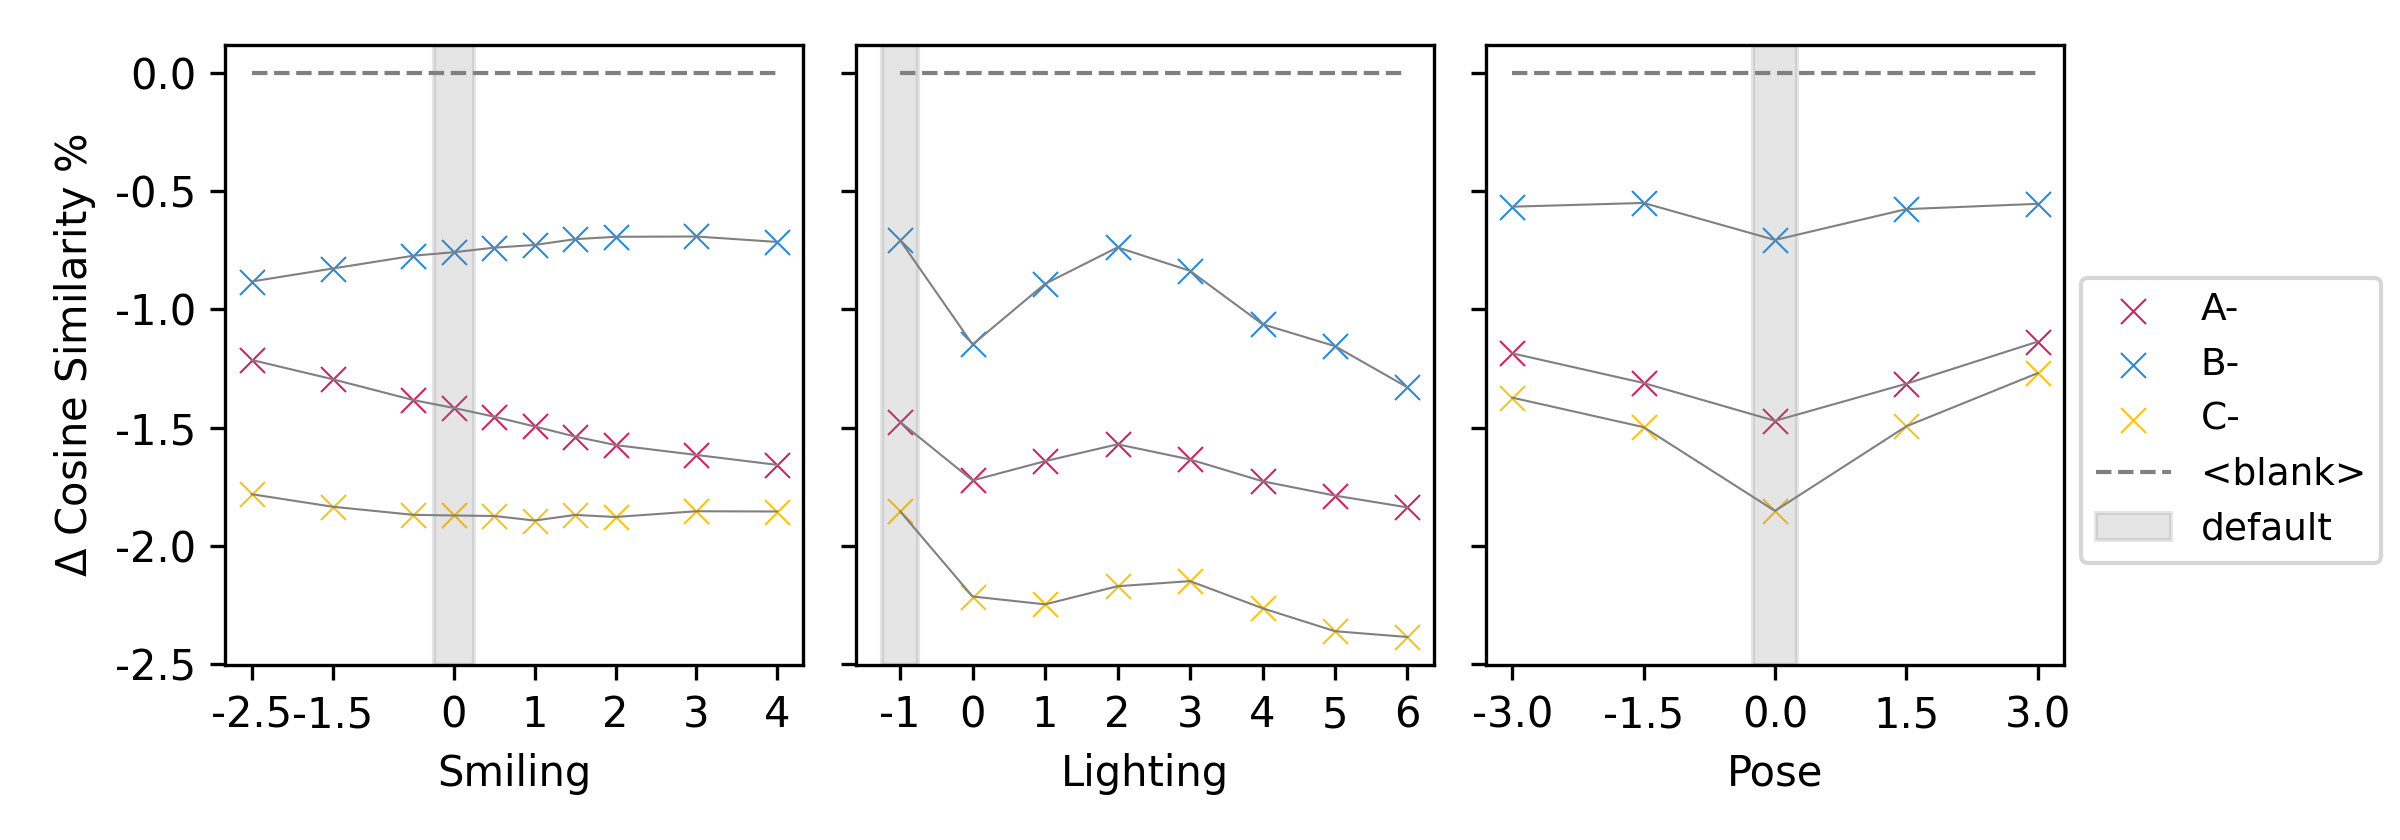
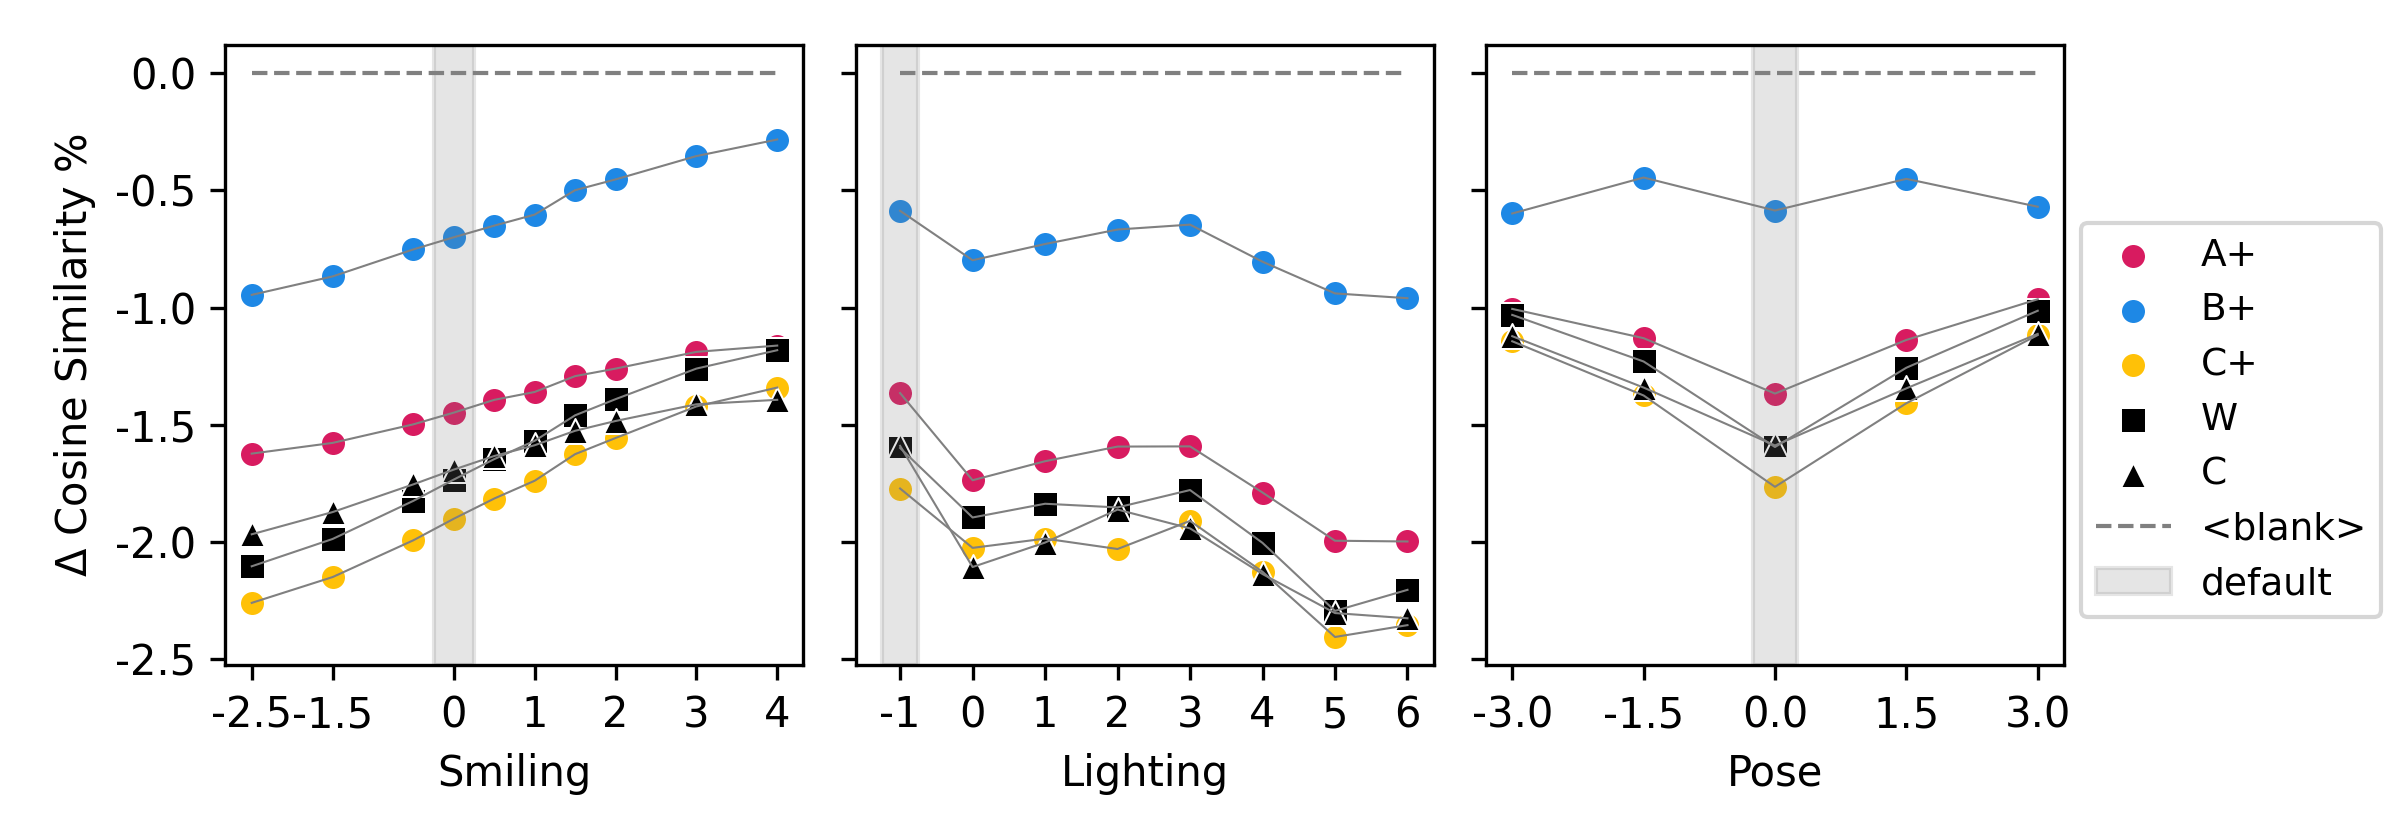
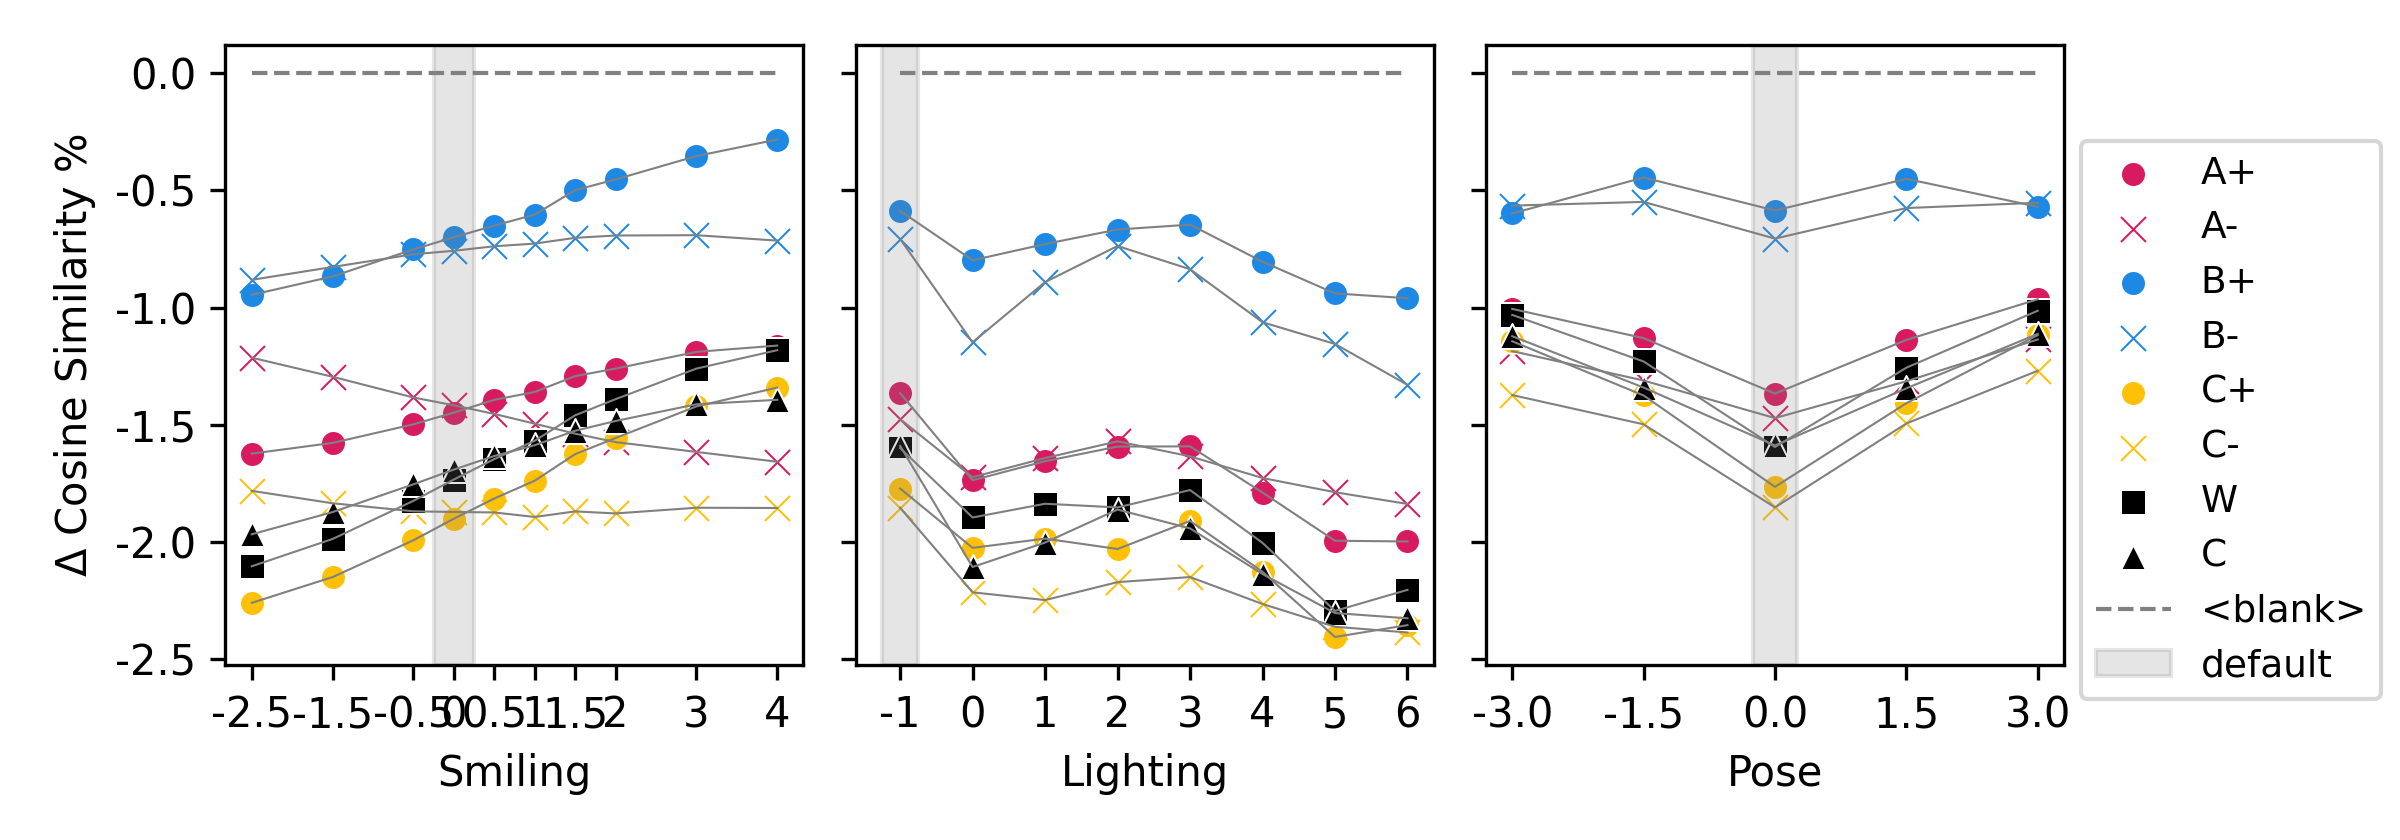
smiling
lighting
pose
smiling
smiling
—
smiling
—
—
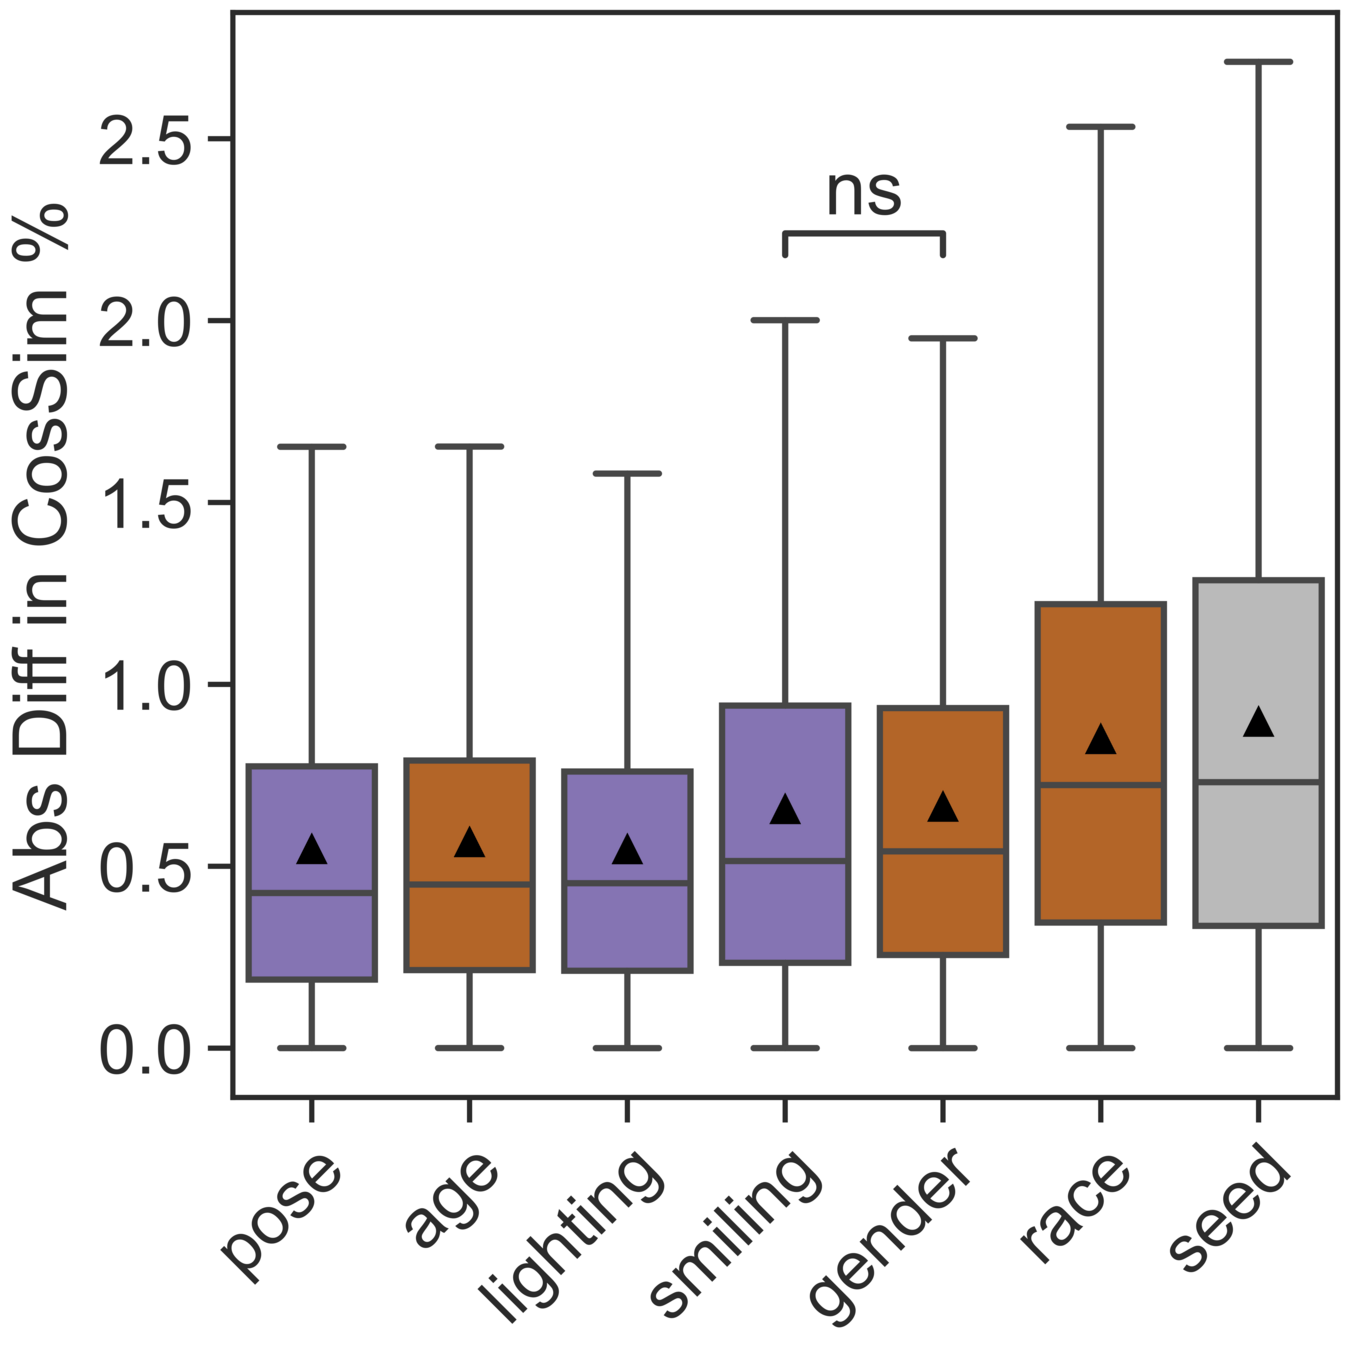
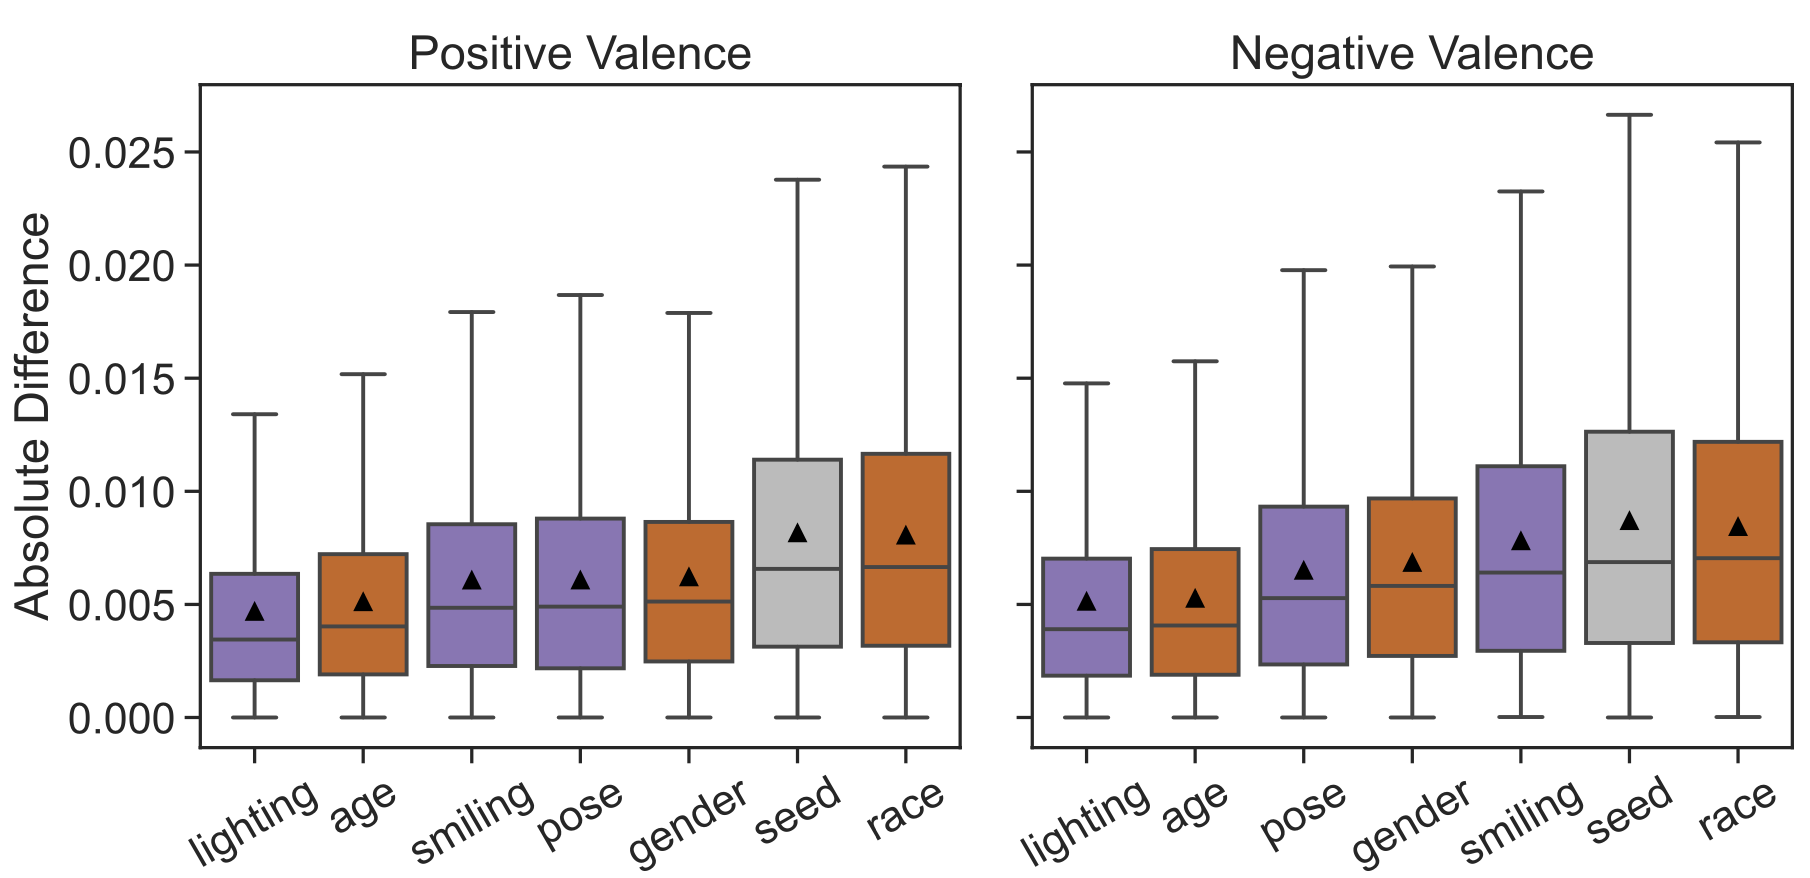
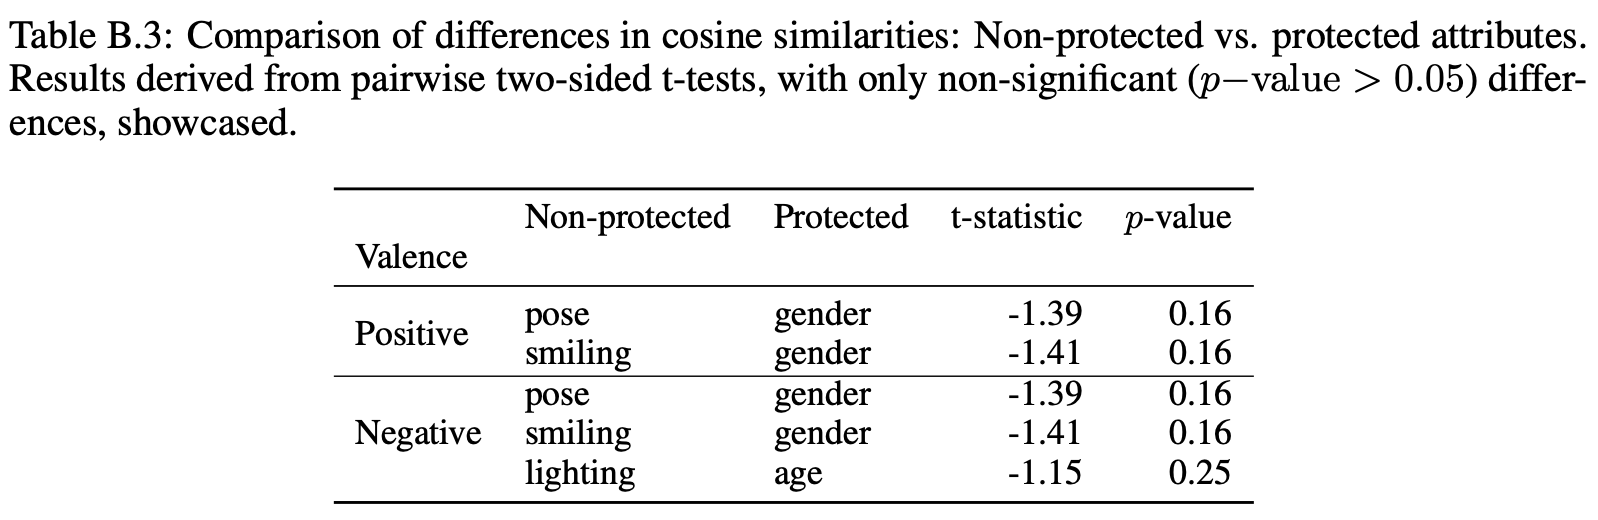
protected and non-protected attributes
—
Wilcoxon Rank-Sum test, independent samples,
\(p<0.001\)
—
—
ns
—
ns
age
female
male
age
female
male
age
Asian
Black
White
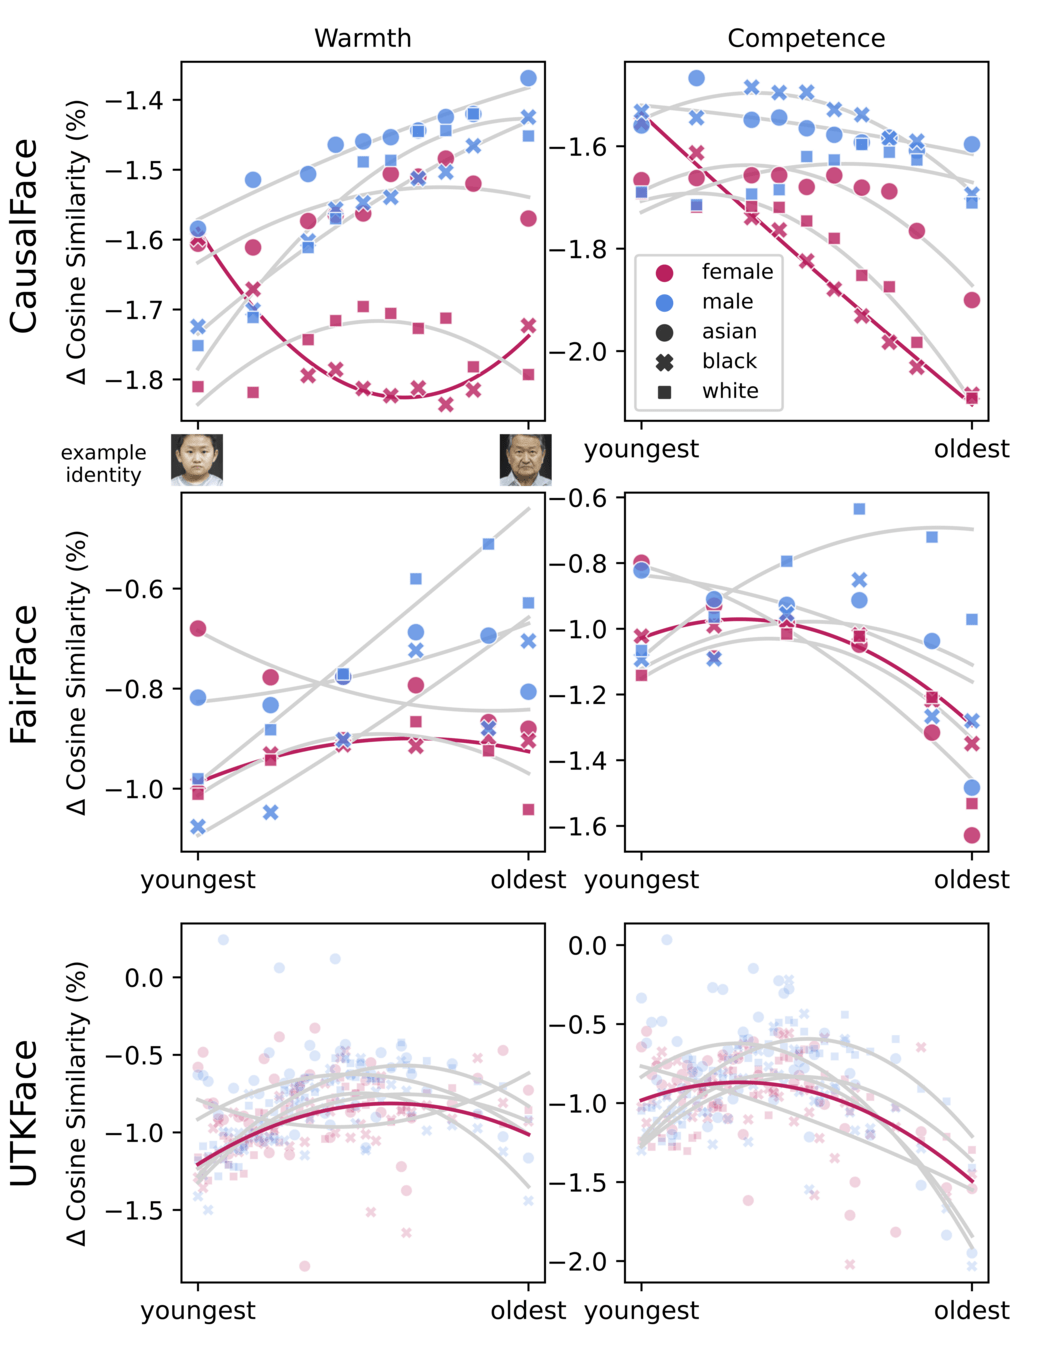
Warmth
Competence
Belief
Communion
–
+
Agency
–
+
Agency
UTKFace
💼 Powerful
👑 High status
🦁 Dominating
💰 Wealthy
💪 Confident
🏆 Competitive
🍂 Powerless
📉 Low-status
🌾 Dominated
🪙 Poor
🐭 Meek
🍂 Passive
UTKFace
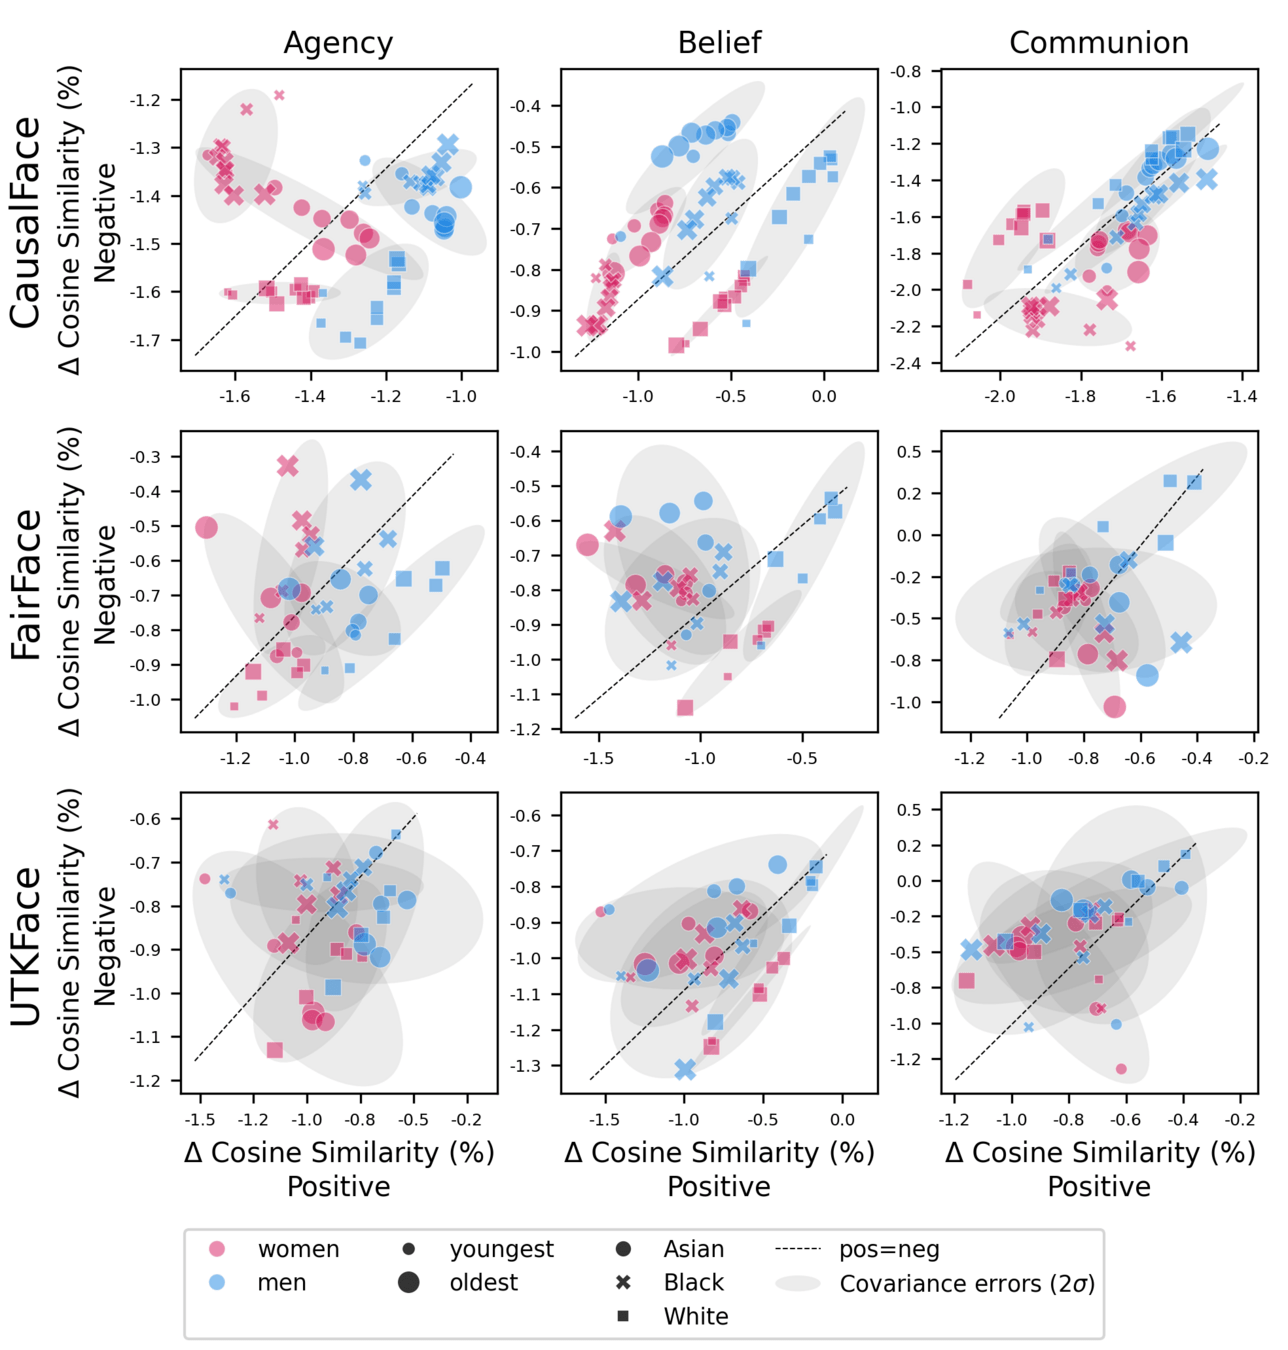
Agency
FairFace
Agency
CausalFace
UTKFace
FairFace
Agency
Distinct Clusters
CausalFace
–
+
youngest
oldest
Agency
+
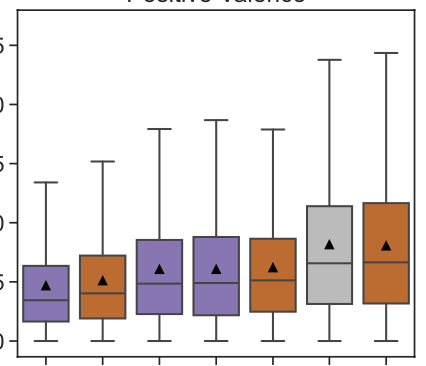
Positive Agency
Black Women
youngest
oldest
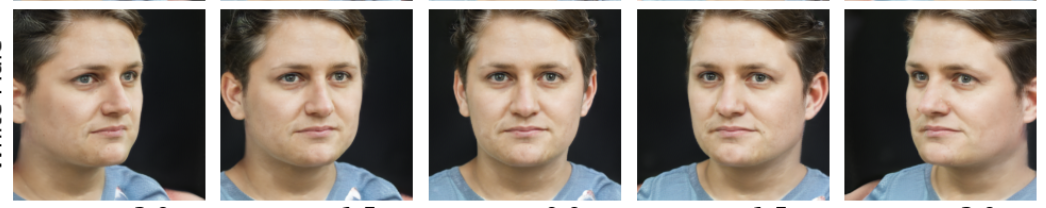
example
identity
age
smiling
female
male
Asian
Black
White
smiling
a photo of a person
a photo of a person
NegativeAgency
Conservative Belief
Negative Communion
a photo of a person
NegativeAgency
Conservative Belief
Negative Communion
Positive Agency
Progressive Belief
Positive Communion
Warmth
Competence
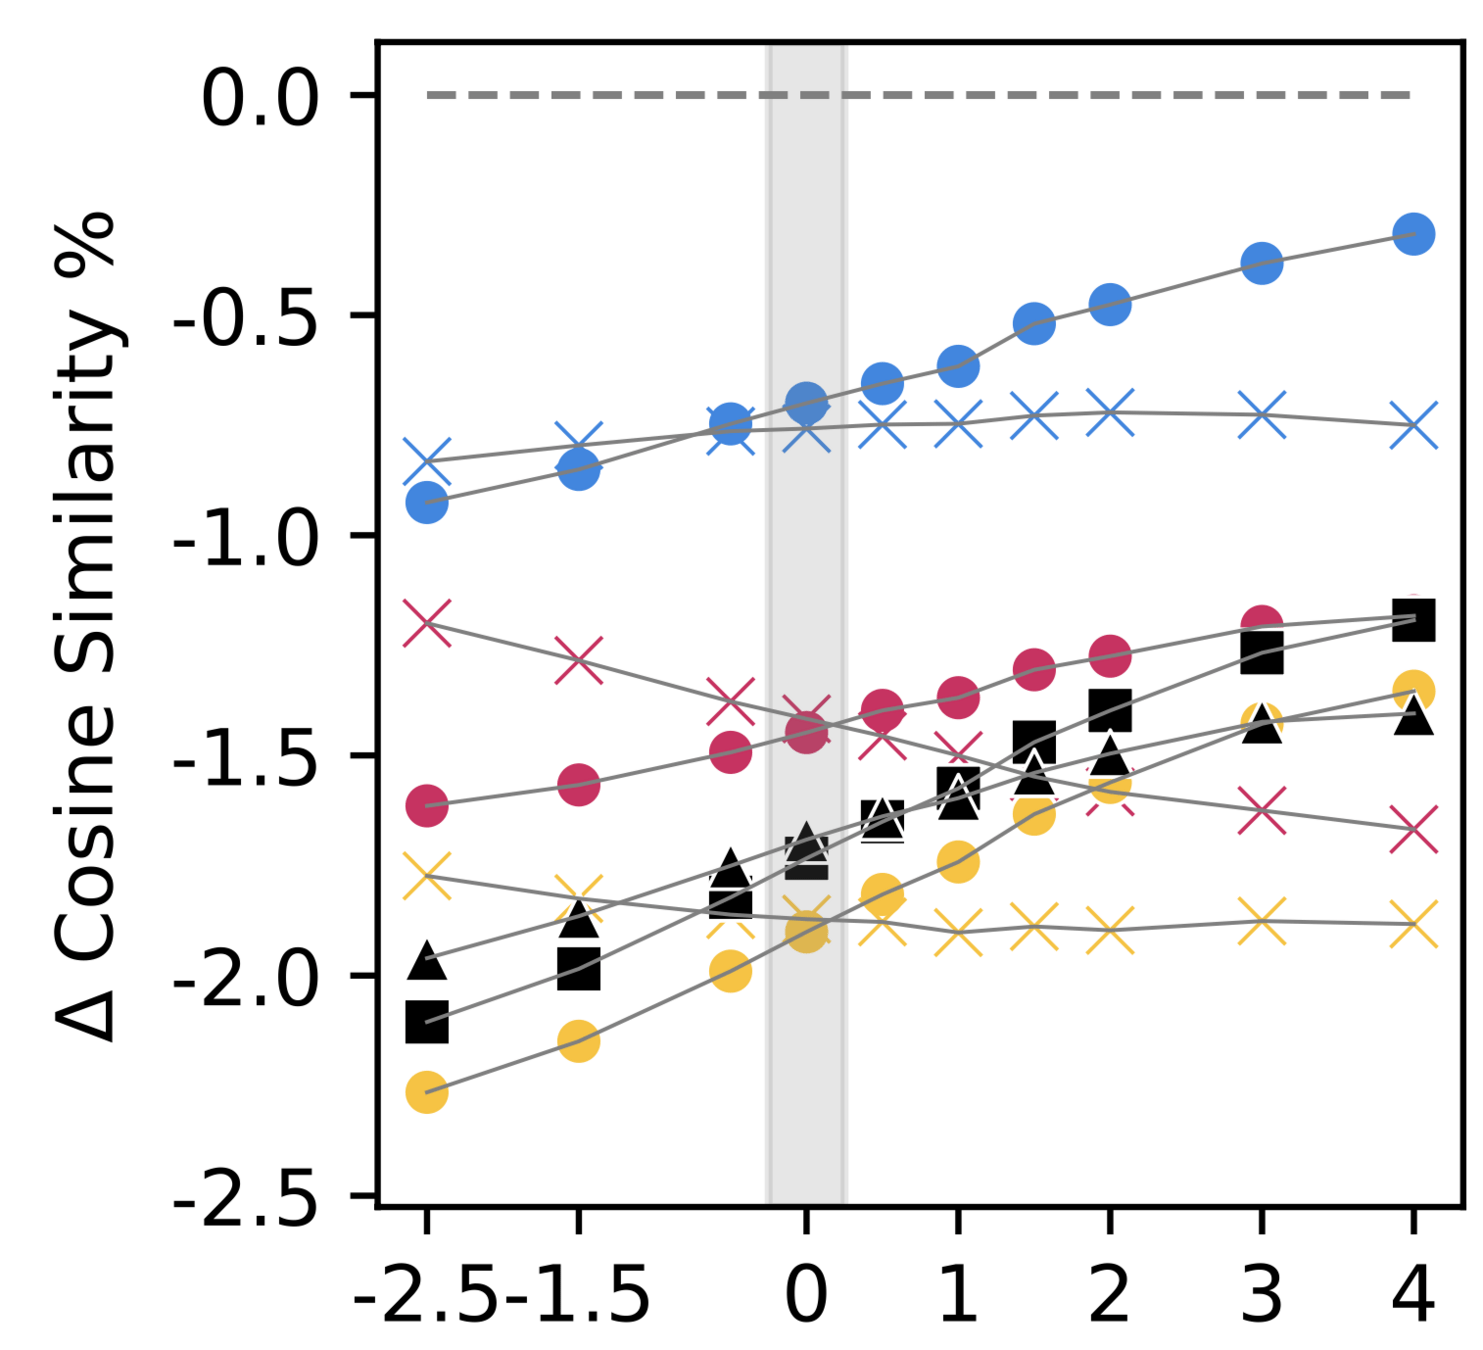
Opposing valences are negatively correlated \( r_{smiling}=-0.21 \).
CLIP demonstrates human-like social perception
most frowning
most smiling
sample
identity
Black Women
most frowning
most smiling
Conservative Belief
Conservative Belief
Ignoring unprotected attributes may lead to incorrect conclusions.
Bias patterns in wild-collected datasets remain hidden due to noise.
Causal image dataset + theory-based text prompts enable the discovery of new phenomena.
carina.hausladen@uni-konstanz.de
slides.com/carinah
pooled sd
asian black
photo of a warm person
photo of a warm person
asian black
—
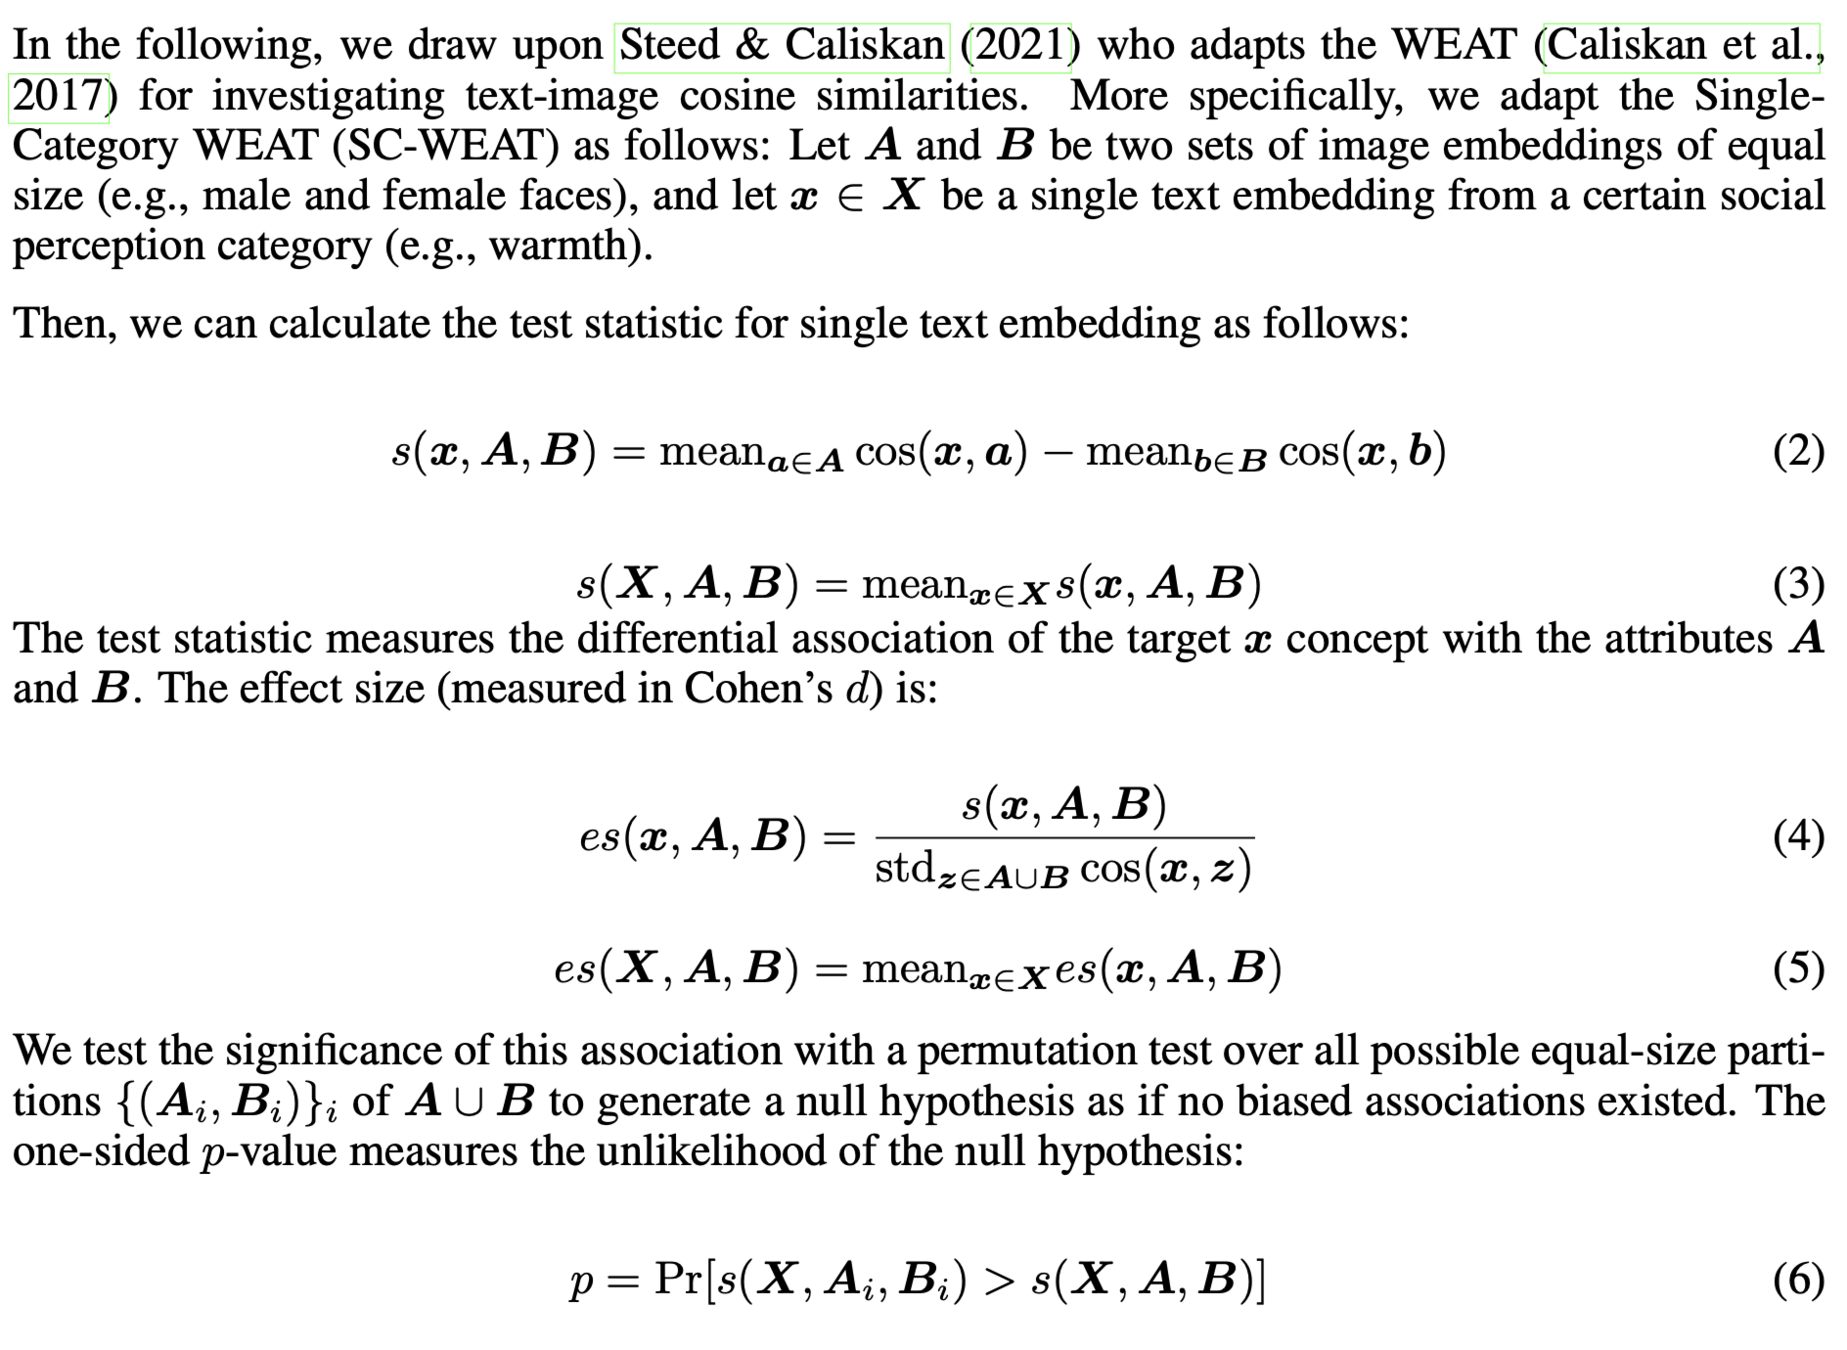
WEAT
Kruskal-Wallis \(\chi^2\) = 1.6,
p-value = 0.4
protected and non-protected attributes
–
+
Heatmap of Pearson correlation coefficients of positive and negative valence dimensions of the ABC model.
a photo of a person
a photo of a person
By Carina Ines Hausladen
Social Perception in VLMs


