Large Science Models:
Foundation Models for
Generalizable Insights Into Complex Systems
with Psycho-social Application
Ishanu Chattopadhyay, PhD
Assistant Professor of Biomedical Informatics & Computer Science
University of Kentucky

DARPA-EA-25-02-05-MAGICS-PA-025

Proposed Concept
- Develop Foundation models of complex systems with
- hundreds to thousands of evolving variables with apriori unknown cross-talk
- no governing equations are know a priori
- reflexivity: system changes if observed
- Learn intrinsic system geometry from data
- Derive equations of motion with variational principles (stationary action on Lagrangian).
- Inference under data sparsity
- Detect data (in)sufficiency, adapt to model drift
- Support forward simulation and perturbation analysis
- Digital twins of individuals & groups wrt to opinion dynamics
MAGICS Alignment
Data inference boundaries & limitations
Alignment validation
Complex phenomena
Adaptation to model obsolence
Psychosocial domain limitations
Precise validation protocols to assess process drift triggering re-calibration/training
Built-in flexibility for changing contexts and non-ergodicity
Scalable to thousands to millions of variables, intrinsic reflexivity
Validate social theories with granular simulations from digital twins of opinion dynamics and social behavior
Component LSM predictors enforce statistical significance of splits in recursive partitioning, ensuring precise uncertainty quantification
*Hothorn, Torsten, Kurt Hornik, and Achim Zeileis. "Unbiased recursive partitioning: A conditional inference framework." Journal of Computational and Graphical statistics 15, no. 3 (2006): 651-674.
emergent macro-structure
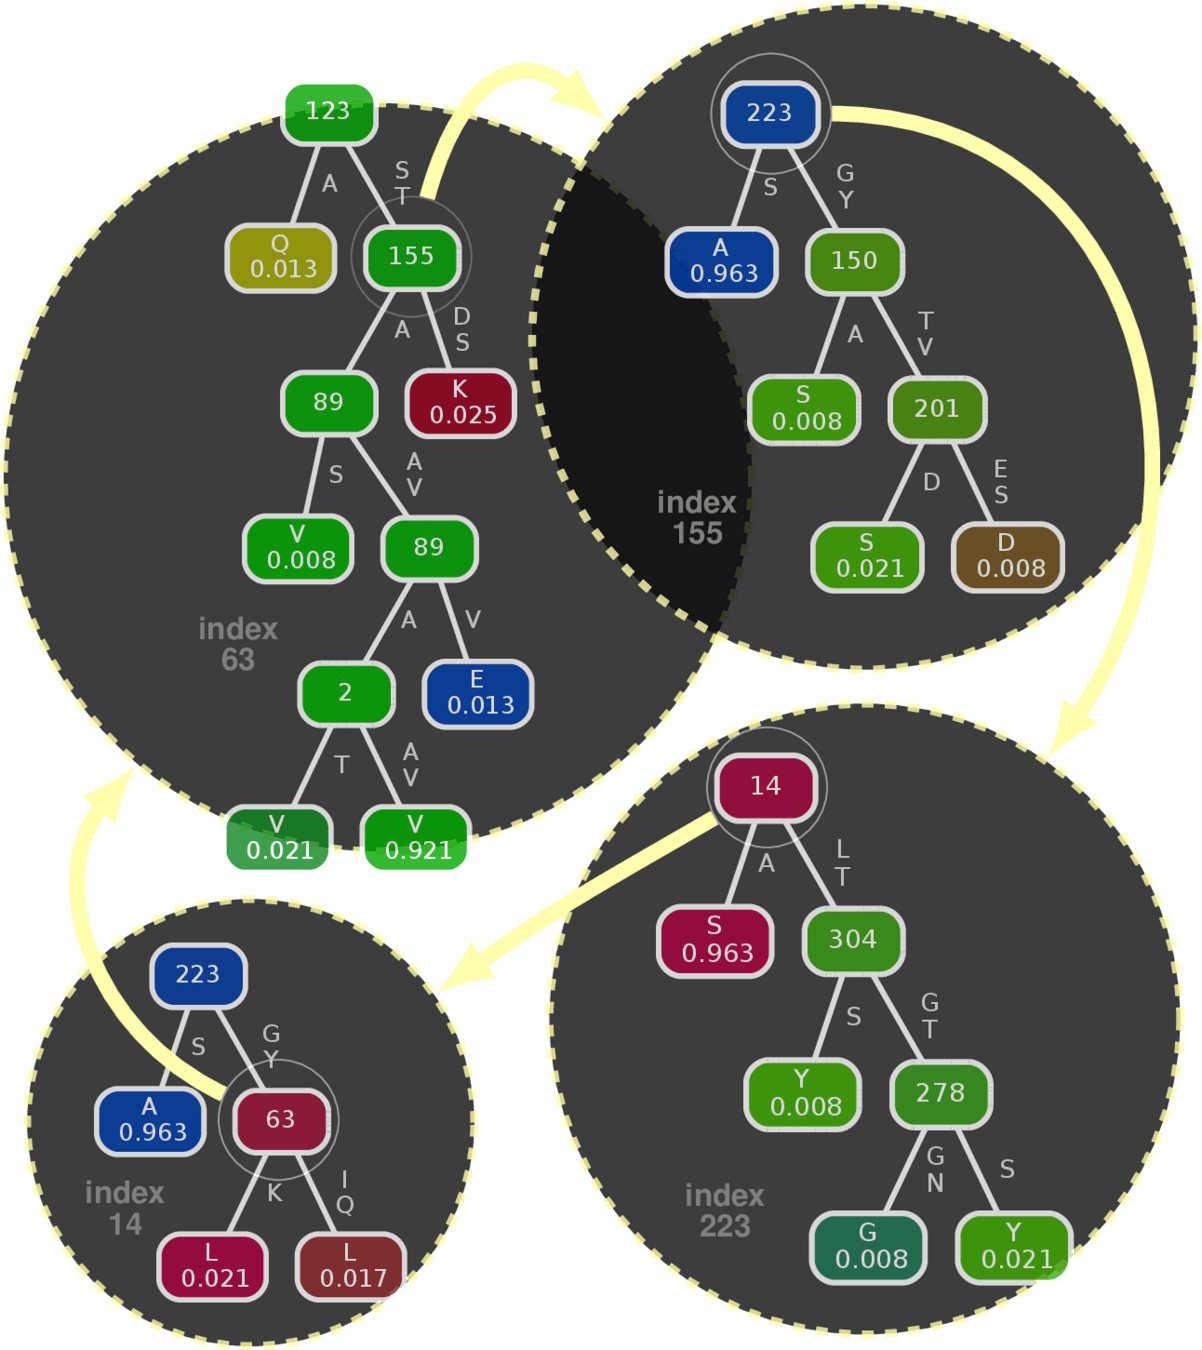
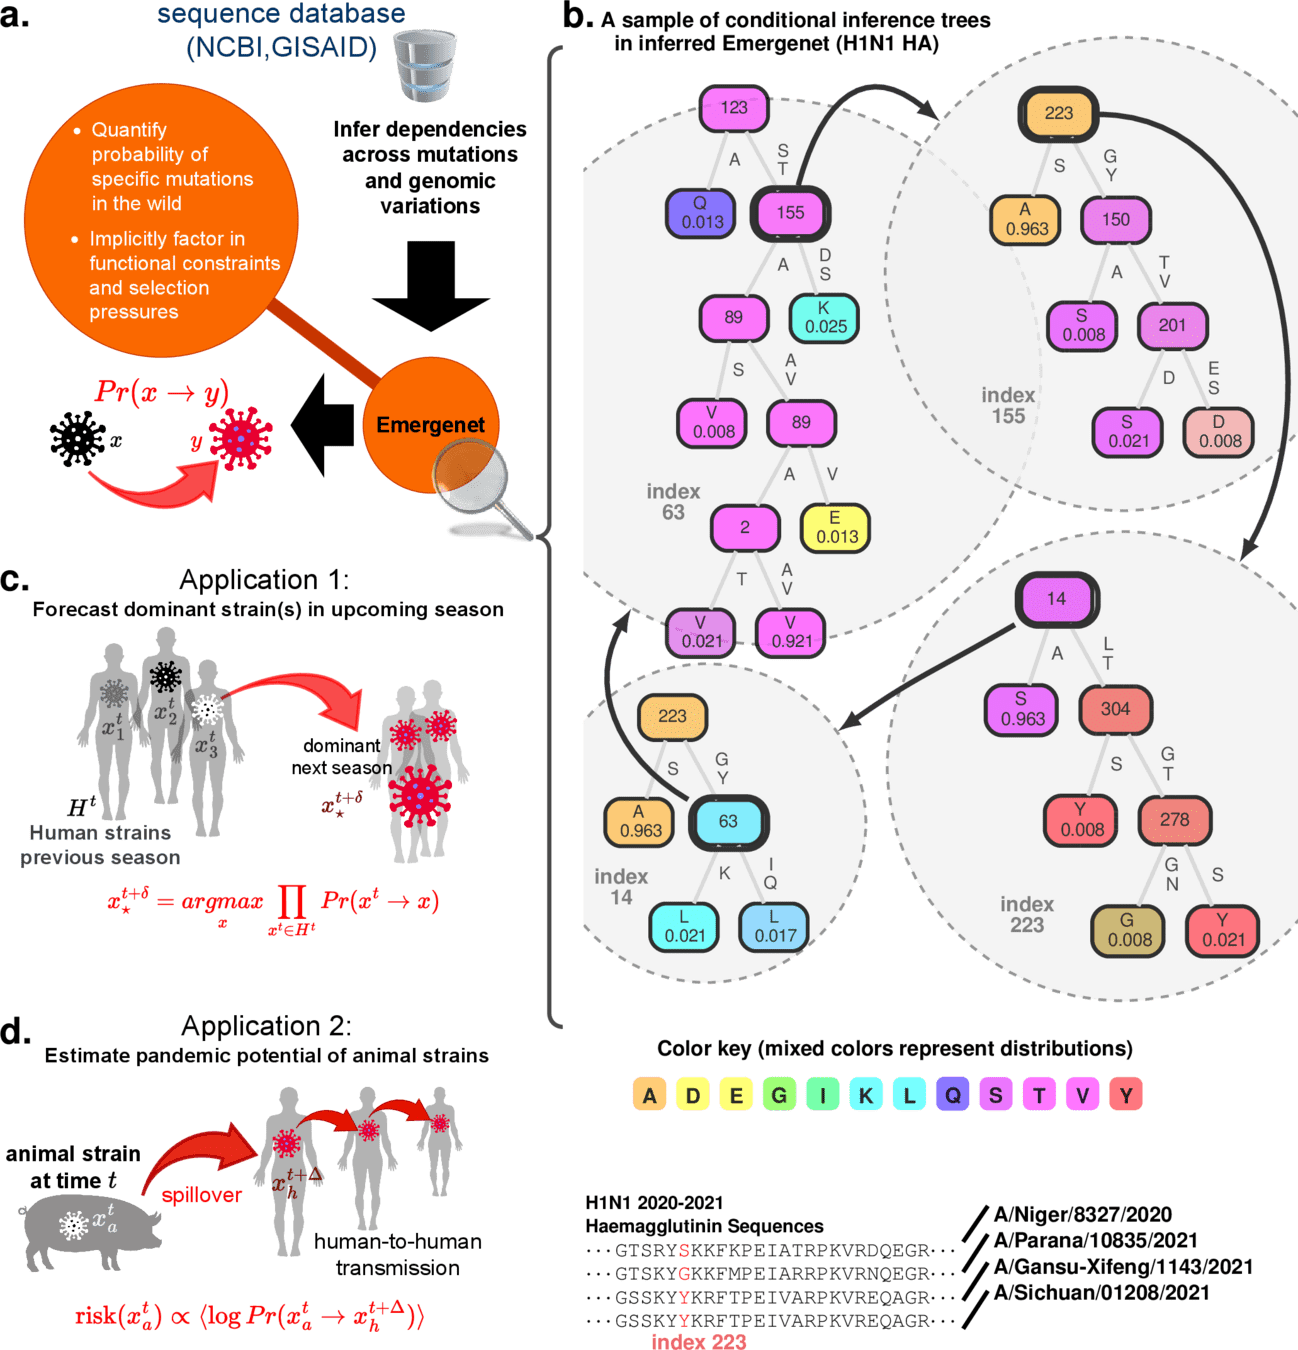
Component predictor (Conditional Inference Tree*)
Example: Influenza A HA protein
Recursive
LSM
forest
LSM Forest
1. How will proposer form and maintain a computationally tractable LSM tree structure given, as proposed, hundreds to thousands of observable variables?
\(\checkmark\)
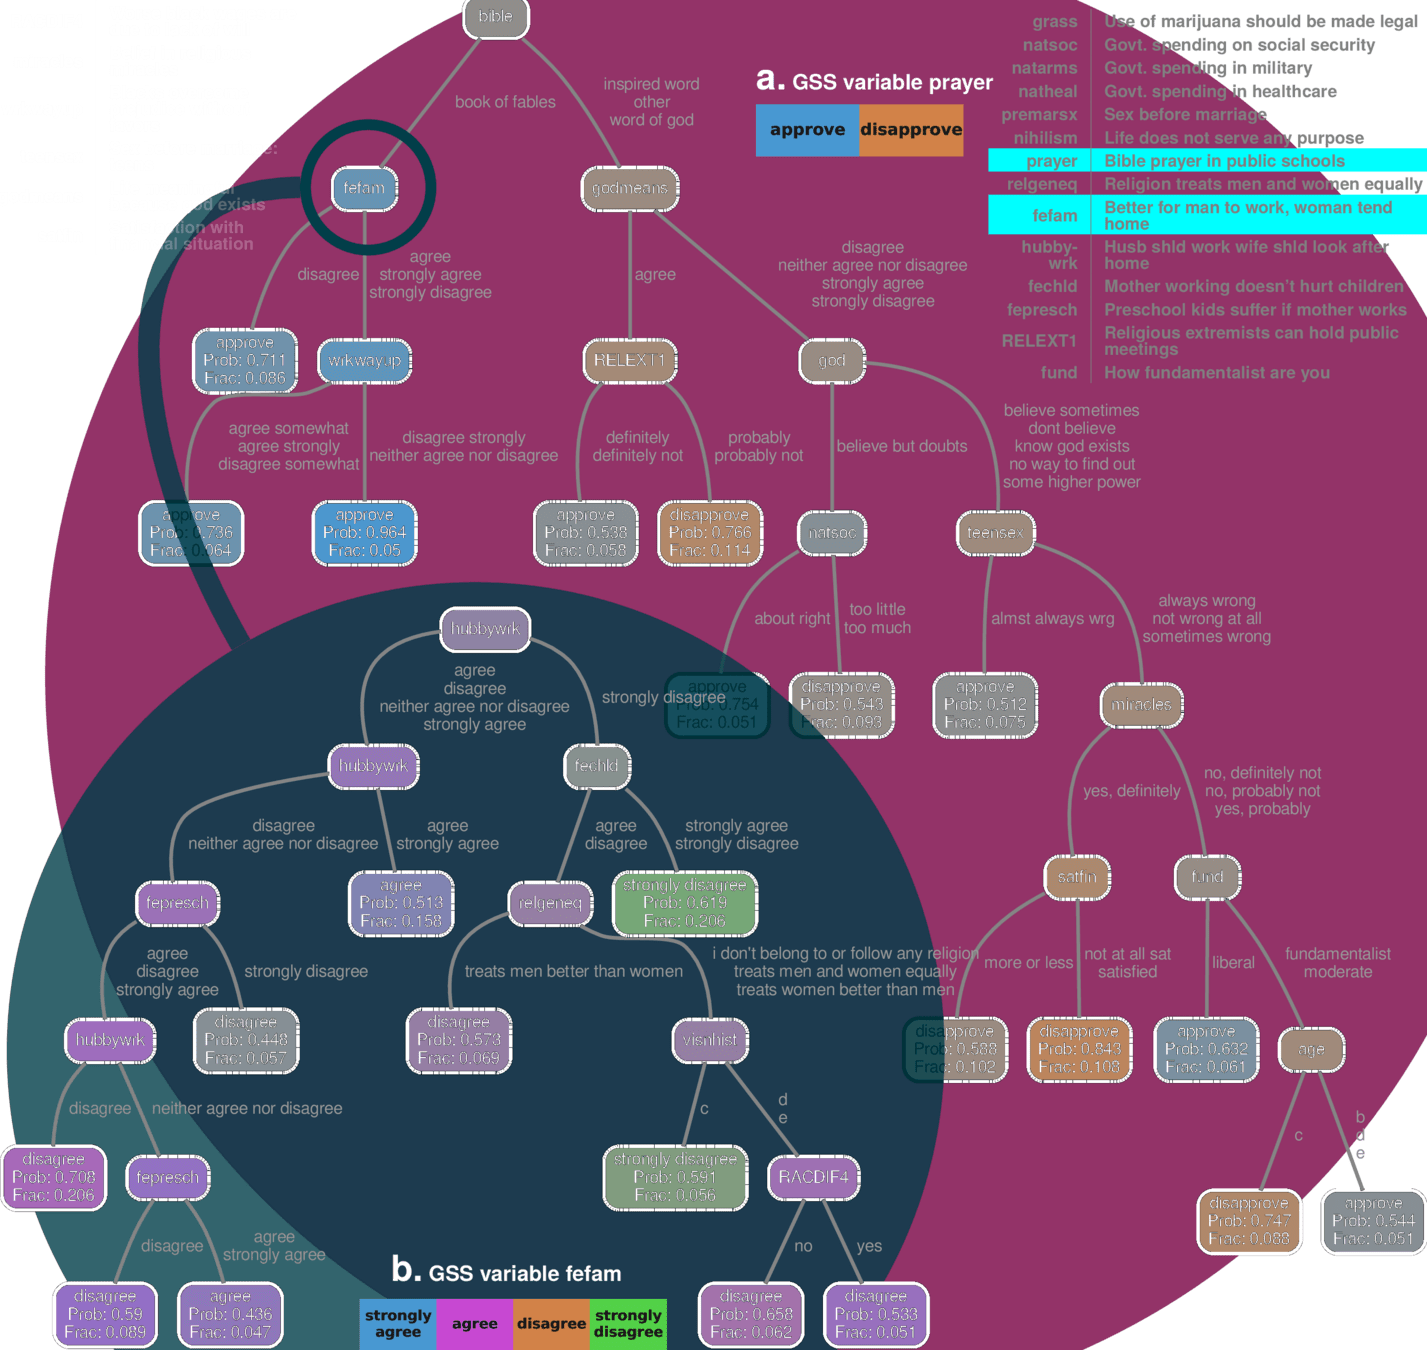
Recursive LSM forest: hyperlinked nodes capturing emergent macro-structures
GSS 2018 dataset
- Set of conditional inference trees (CIT)
- Strict statistical guarantees: quantifies inference uncertainty
- Each tree models exactly one variable as a function of potentially all other variables
- Non-leaf nodes are "hyperlinked" to other trees
Large Science Models
1. How will proposer form and maintain a computationally tractable LSM tree structure given, as proposed, hundreds to thousands of observable variables?
\(\checkmark\)
GSS 2018 dataset
- Each predictor is inferred independently
- Can scale up to thousands of variables in Python implementation
- Further scale-up \(10^6 - 10^8\) needs C/C++ implementation
Full Example of Hyperlinked Trees
Large Science Models: Mathematical Framework
| reliten | gunlaw | abany | --- | grass | |
|---|---|---|---|---|---|
| Person 1 | |||||
| Person 2 | |||||
| --- | |||||
| Person m |
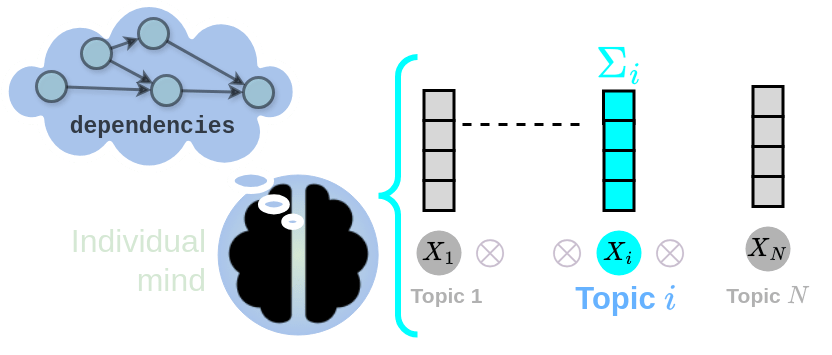
observables
samples
Distributions over alphabet \(\Sigma^i\)
Individual Predictor (CIT)
cross-talk
Tension between predicted and observed distribution drives change
Example
GSS topic: There should be more gun-control
\(\psi^i\)
| strongly agree | agree | neutral | disagree | strongly disagree |
Digital Twin
\(\phi\) estimates \(\psi\)
Examples: GSS, ANES, WVS, ESS, Eurobarometer, Afrobarometer, Asian Barometer etc
group
individual
estimate is always a non-empty non-degenerate distribution
missing observation
Large Science Models: Properties
LSM-Distance Metric*
where \(D_{JS}(P\vert \vert Q)\) is the Jensen-Shannon divergence.
Large Deviation Bound*
Induced Riemannian metric tensor
This bound connects ``closeness'' of samples to the odds of perturbing from one to the other, bridging geometry to dynamics
Ergodic Projection
(Sanov's Theorem, Pinkser's Inequality)
\(\psi\)
\(\psi'\)
\(\theta\)
"spatial average": average of all plausible worldviews or states
* Sizemore, Nicholas, Kaitlyn Oliphant, Ruolin Zheng, Camilia R. Martin, Erika C. Claud, and Ishanu Chattopadhyay. "A digital twin of the infant microbiome to predict neurodevelopmental deficits." Science Advances 10, no. 15 (2024): eadj0400. https://www.science.org/doi/full/10.1126/sciadv.adj0400
persistence probability
Ergodic dispersion
Central to Model Drift Quantification
Start with opinion vector with all entries missing
This is a standard Physics construct, quantifying curvature of the underlying latent geometry
Easily computable in LSM framework!
Apply \(\phi^i\)
Random variable quantifying dispersion around the spatial average of worlviews
const. scaling as \(N^2\)
Digital Twin & Fidelity of Simulation
Sample predicted distributions
perturbed state within \(\epsilon\) of \(\psi\)
| Variable | Masked | Reconstructed |
|---|---|---|
| spkcom | allowed | allowed |
| colcom | not fired | not fired |
| spkmil | allowed | allowed |
| colmil | allowed | not allowed |
| libmil | not remove | not remove |
| libhomo | not remove | not remove |
| reliten | strong | no religion |
| pray | once a day | once a day |
| bible | inspired word | word of god |
| abhlth | yes | yes |
| abpoor | no | no |
| pillok | agree | agree |
| intmil | very interested | very interested |
| abpoorw | always wrong | not wrong at all |
| godchnge | believe now, always have | believe now, always have |
| prayfreq | several times a week | several times a week |
| religcon | strong disagree | disagree |
| religint | disagree | disagree |
| Variable | Masked | Reconstructed |
|---|---|---|
| spkcom | allowed | allowed |
| colcom | not fired | not fired |
| libmil | not remove | not remove |
| libhomo | not remove | not remove |
| gunlaw | favor | favor |
| reliten | no religion | no religion |
| prayer | approve | approve |
| bible | book of fables | inspired word |
| abnomore | yes | yes |
| abhlth | yes | yes |
| abpoor | yes | yes |
| abany | yes | yes |
| owngun | no | no |
| intmil | moderately interested | moderately interested |
| abpoorw | not wrong at all | not wrong at all |
| godchnge | believe now, didn't used to | believe now, always have |
| prayfreq | several times a week | several times a week |
2018 GSS individual samples
Digital Twin
\(\checkmark\) 8. While you mention digital twins as an end result, please clarify what exactly these twins represent (agents, systems, etc.).\(\dag\)
-Neighborhood of state \(\psi\)
Definition
Sample neighborhood to impute missing data
}
\(\checkmark\) 5. Provide more details on how you will measure "fidelity of forward simulation" as mentioned in your metrics.**
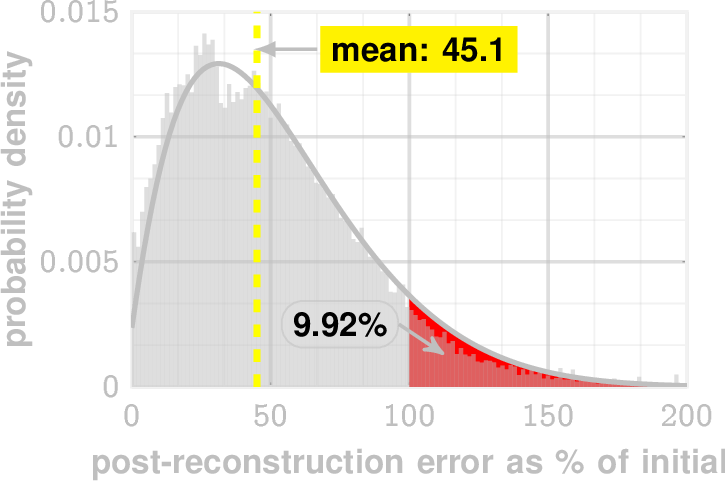
2018 GSS out-of-sample reconstruction
post-reconstruction error ratio (%)
LSM sampling: sampling the \(\epsilon\)-neighborhood of a state or worldview allows reconstruction of censored opinions
examples
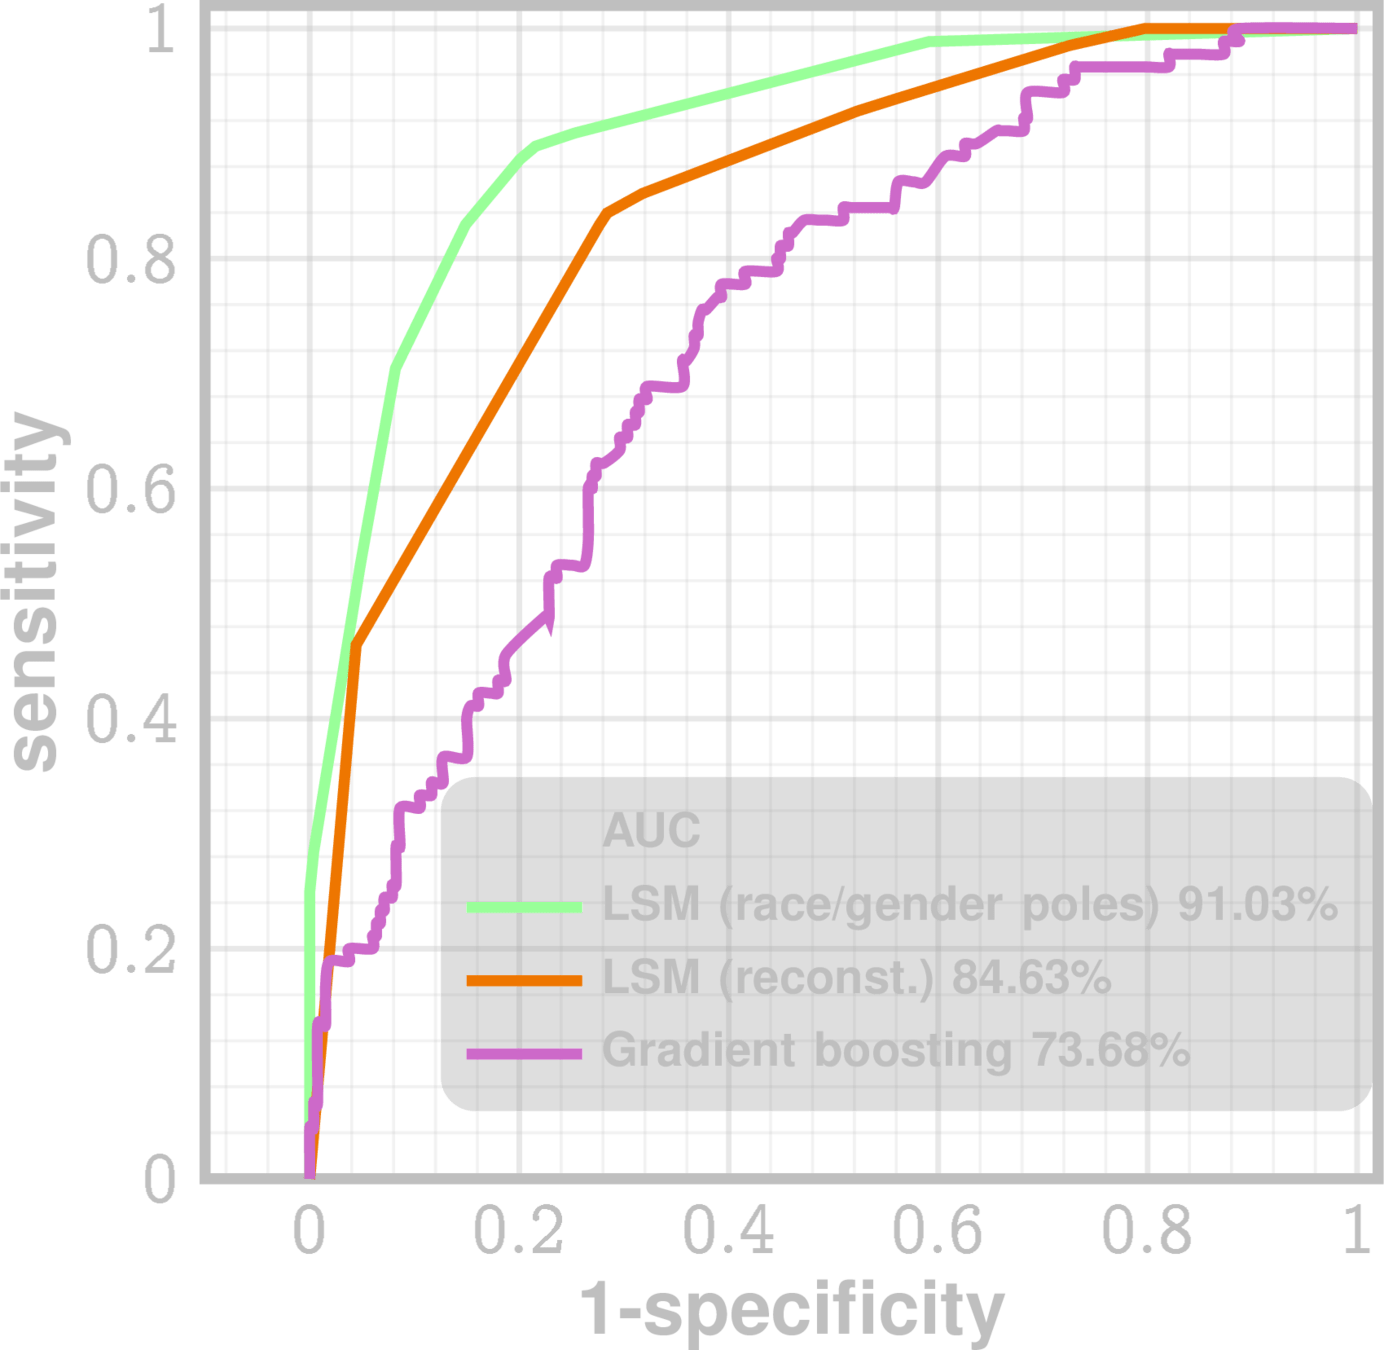
Predictive ability of LSM quantified as ability to reconstruct censored out-of-sample opinions**
Null state (all missing observations)
Valid perturbations/ simulations
LSM sampling allows simulating opinion perturbations
Both Individuals and groups maybe modeled as digital twins\(\dag\)
Global Emergent Structure via Clusters & Poles
2018 GSS
Polar separation over time
2016 Presidential Election Vote Prediction

2004
| abany | no | yes |
| abdefctw | always wrong | not wrong at all |
| abdefect | no | yes |
| abhlth | no | yes |
| abnomore | no | yes |
| abpoor | no | yes |
| abpoorw | always wrong | not wrong at all |
| abrape | no | yes |
| absingle | no | yes |
| bible | inspired word | book of fables |
| colcom | fired | not fired |
| colmil | not fired | not allowed |
| comfort | strongly agree | strongly disagree |
| conlabor | hardly any | a great deal |
| godchnge | believe now, always have | don't believe now, never have |
| grass | not legal | legal |
| gunlaw | oppose | favor |
| intmil | very interested | not at all interested |
| libcom | remove | not remove |
| libmil | not remove | remove |
| maboygrl | true | false |
| owngun | yes | no |
| pillok | agree | strongly agree |
| pilloky | strongly disagree | strongly agree |
| polabuse | no | yes |
| pray | several times a day | never |
| prayer | disapprove | approve |
| prayfreq | several times a day | never |
| religcon | strongly disagree | strongly agree |
| religint | strongly disagree | strongly agree |
| reliten | strong | no religion |
| rowngun | yes | no |
| shotgun | yes | no |
| spkcom | not allowed | allowed |
| spkmil | allowed | not allowed |
| taxrich | about right | much too low |
conservative pole
liberal pole
Clustering LSM distance \(\theta(x,y)\) between out-of-sample individuals
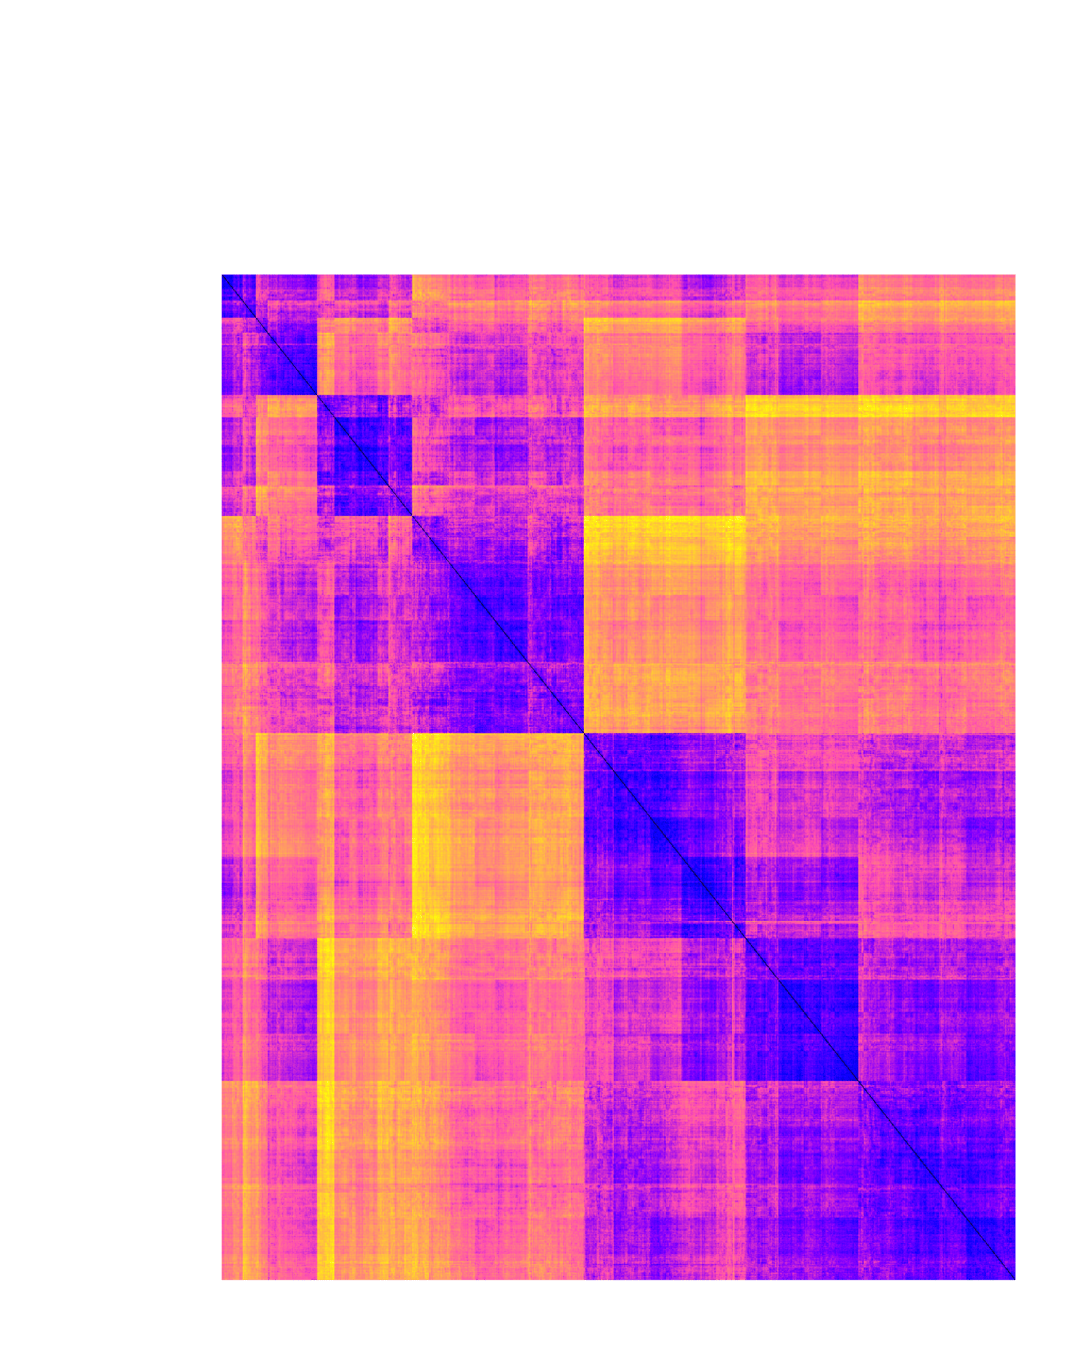
conservative
liberal
poles:
partial states aligning with extreme opposing worldviews
- Compare across time and different GSS surveys
- Derived features for individuals (ideology index)
Predict 2016 votes using ideology index
\(\checkmark\) 6. Explain how you will measure the accuracy of predicted structure emergence and data sufficiency.
Emergent global structure
Reflexivity and State Collapse on Observation
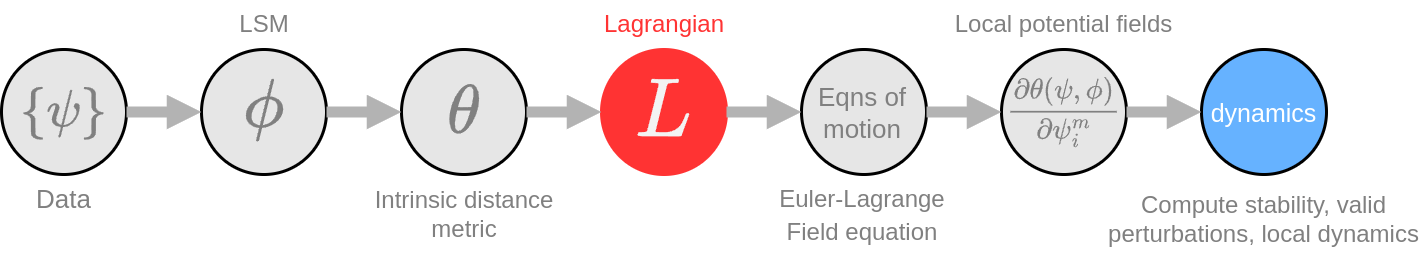
Emergent Equations of Motion
Define Lagrangian*
Via the Euler-Lagrange Equations\(^\dag\):
Over-damped Gradient flow Equation*
where \(-g^{km}\) is the inverse metric tensor
kinetic energy
state collapse
strongly agree
agree
neutral
disagree
strongly disagree
strongly agree
agree
neutral
disagree
strongly disagree
Query/
Observation
\(X_i\)
Non-local Influence propagation on measurement/observation (QM-like)

potential energy
* Einstein notation used
Goldstein, Herbert, et al. Classical Mechanics. 3rd ed., Pearson, 2002.
\(^\dag\)
Principle of stationary action
Dynamics
Local potential field eqn
Local Potential Fields
Stable
(captured by local extrema)
Free to move locally towards extrema
Why propaganda works so well
* “Exposure to opposing views on social media can increase political polarization”
by Christopher A. Bail et al., published in PNAS in September 2018 (Vol. 115, No. 37, pp. 9216–9221; DOI: 10.1073/pnas.1804840115)
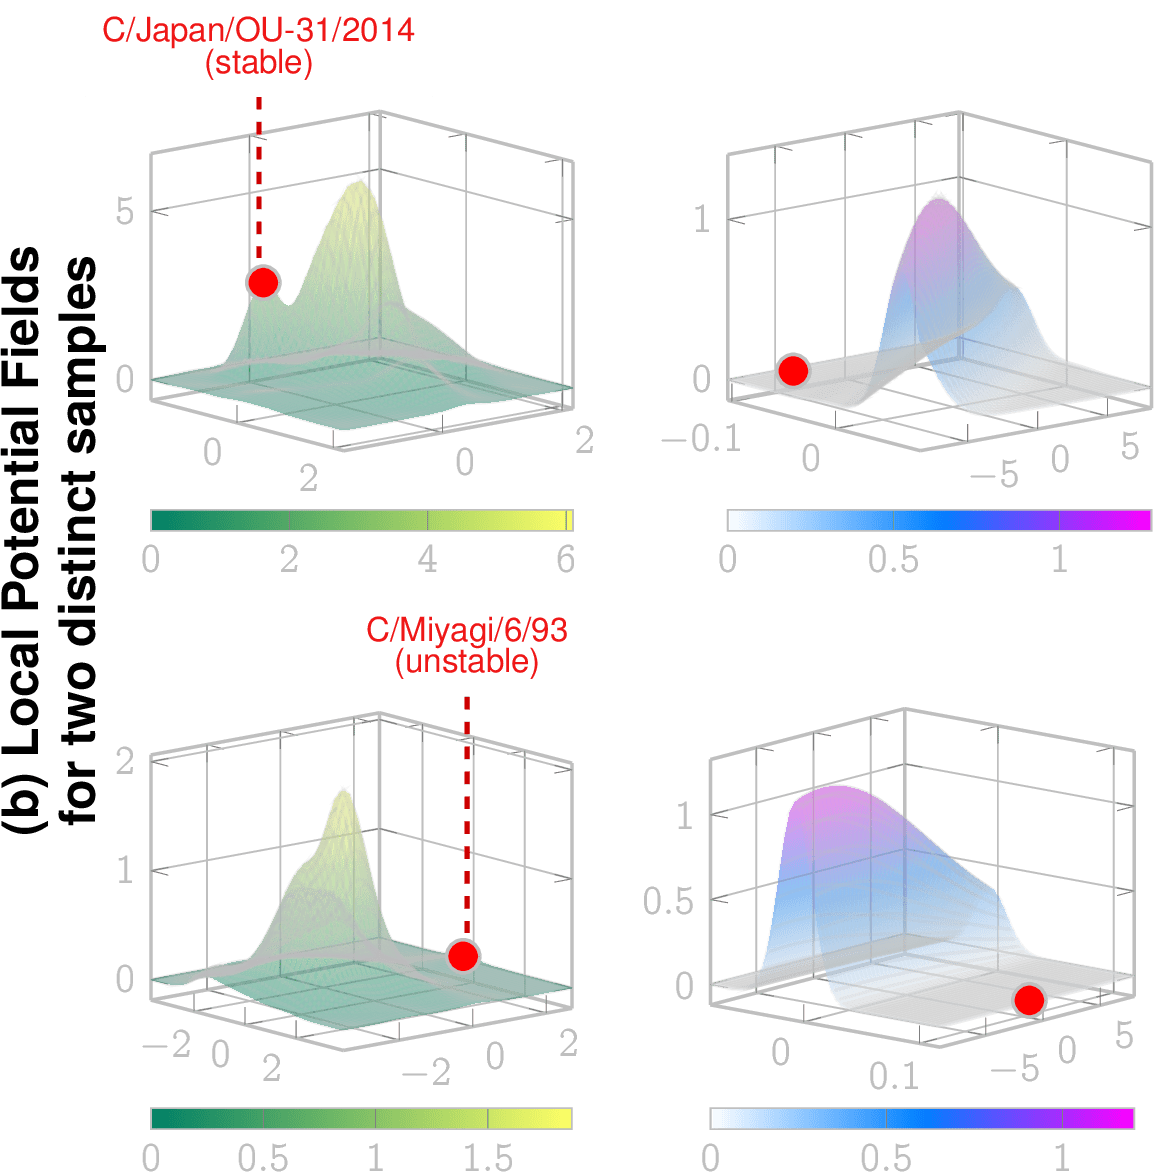
GSS 2018 individuals and neighborhoods
Influenza C : strains and their neighborhoods
Even random perturbations will tend to move individuals towards local extrema increasing polarization
*
- Polarization is "easy", can occur via random perturbations (falling into the local well)
Hypotheses
Observation: This lineage (Mississippi lineage) is now extinct since 2022/23
stable lineage
Implications on Social Theory
The LSM tells the latent opinion "space-time" how to curve, the curved "space-time" tells opinions how to change.
Local potential fields can be computed given the LSM and dynamical considerations, which reveal future evolution
- De-polarization is "hard", needs specific communication (climbing up from the well)
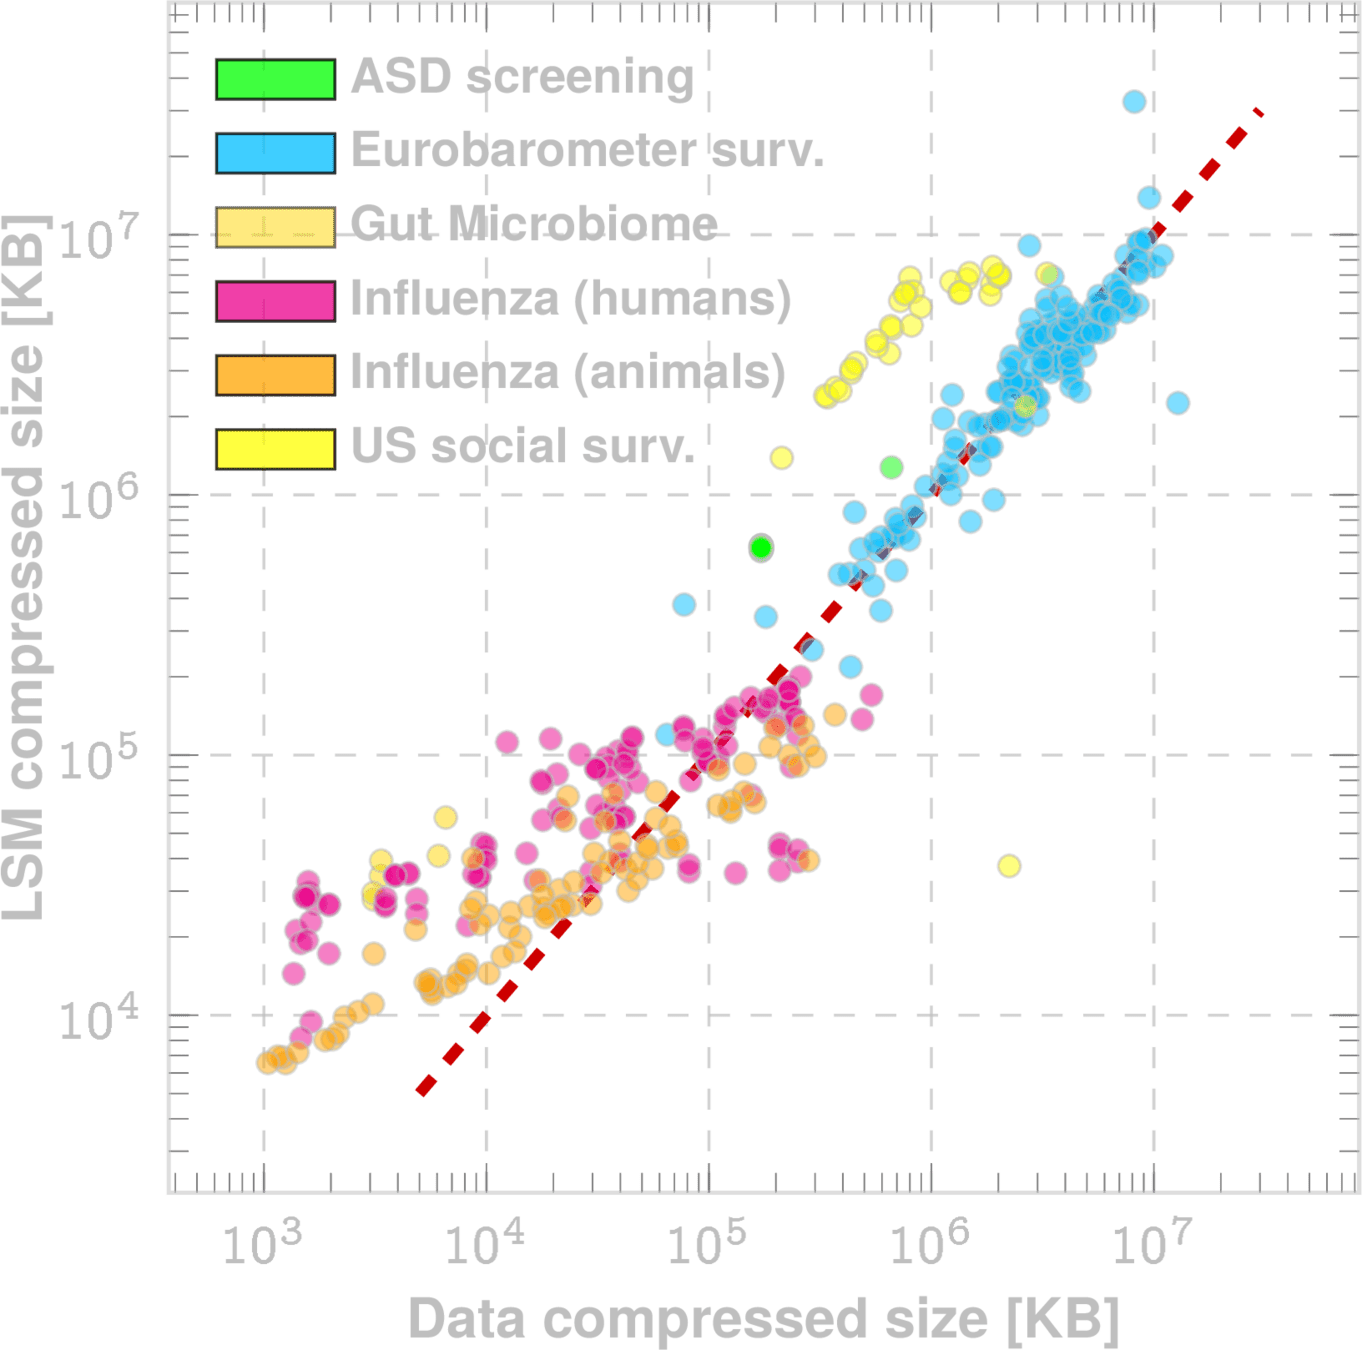
Data Sufficiency via Conservation of Complexity
The No-cheating Thorem: Generative models cannot cheat on complexity
Kolmogorov Complexity
Optimal Generative Model
compressed data representation
compressed model representation
Theorem
Conservation Law arising from the continuous symmetry of typicality*
Saturation relation:
Data Sufficiency Statistic \(\mu_0\)
We need LSM-sampling to calculate this
*Noether's Theorem
For every continuous symmetry of a physical system, there exists a corresponding conserved quantity
\(\checkmark\) 6. Explain how you will measure the accuracy of predicted structure emergence and data sufficiency.
How much more data do we need?
Data saturation
Data deficient
Needed
Current
Empirical Validation
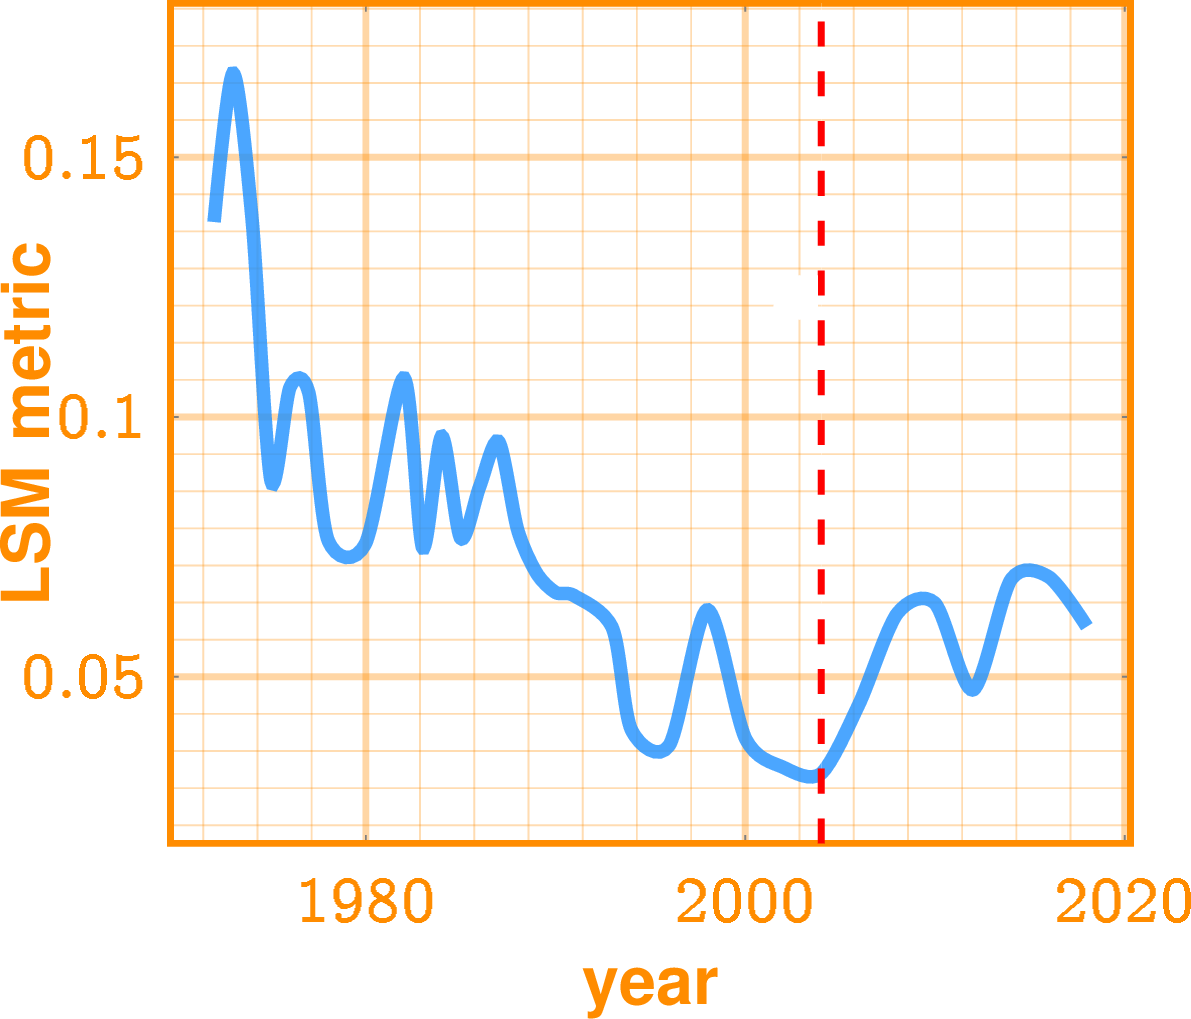
Model Drift Quantification
Ergodic dispersion
Z-value of dispersion
Do new samples (survey respondents) still conform to the model?
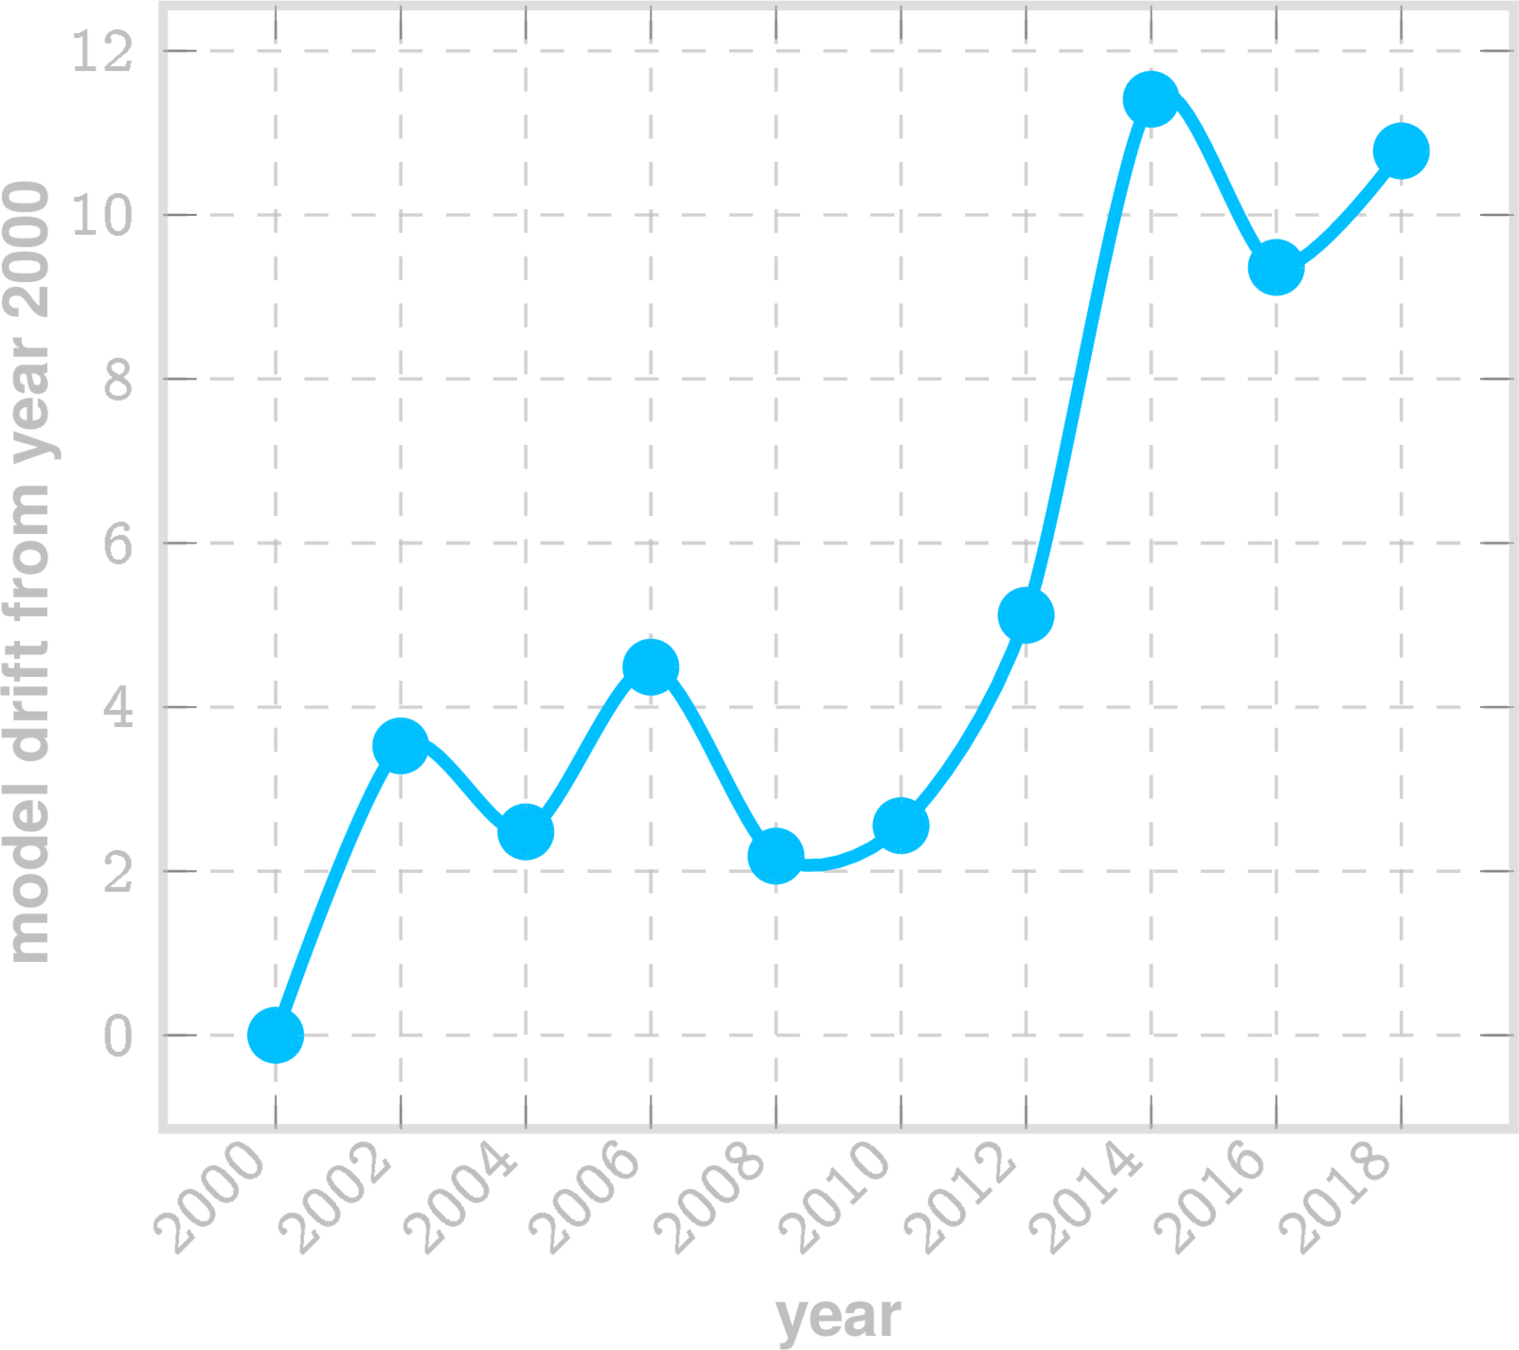
GSS Model drift
\(\checkmark\) 11. Provide more detail on how your model would adapt to or identify significant shifts in system dynamics over time (model drift).
ergodic projection (all missing values)
A random belief state (with possibly missing entries)
random variable
normal variate
Model drift stochastic process (\(\zeta\))
assess if \(\zeta\) is stationary: if not then new samples are not conforming to model
Example for GSS LSM inferred for year 2000
Large Science Models & Ergodicity
\(\checkmark\) 4. Address whether your approach makes assumptions regarding ergodicity, and if so, how these assumptions affect the model's applicability to non-ergodic systems.
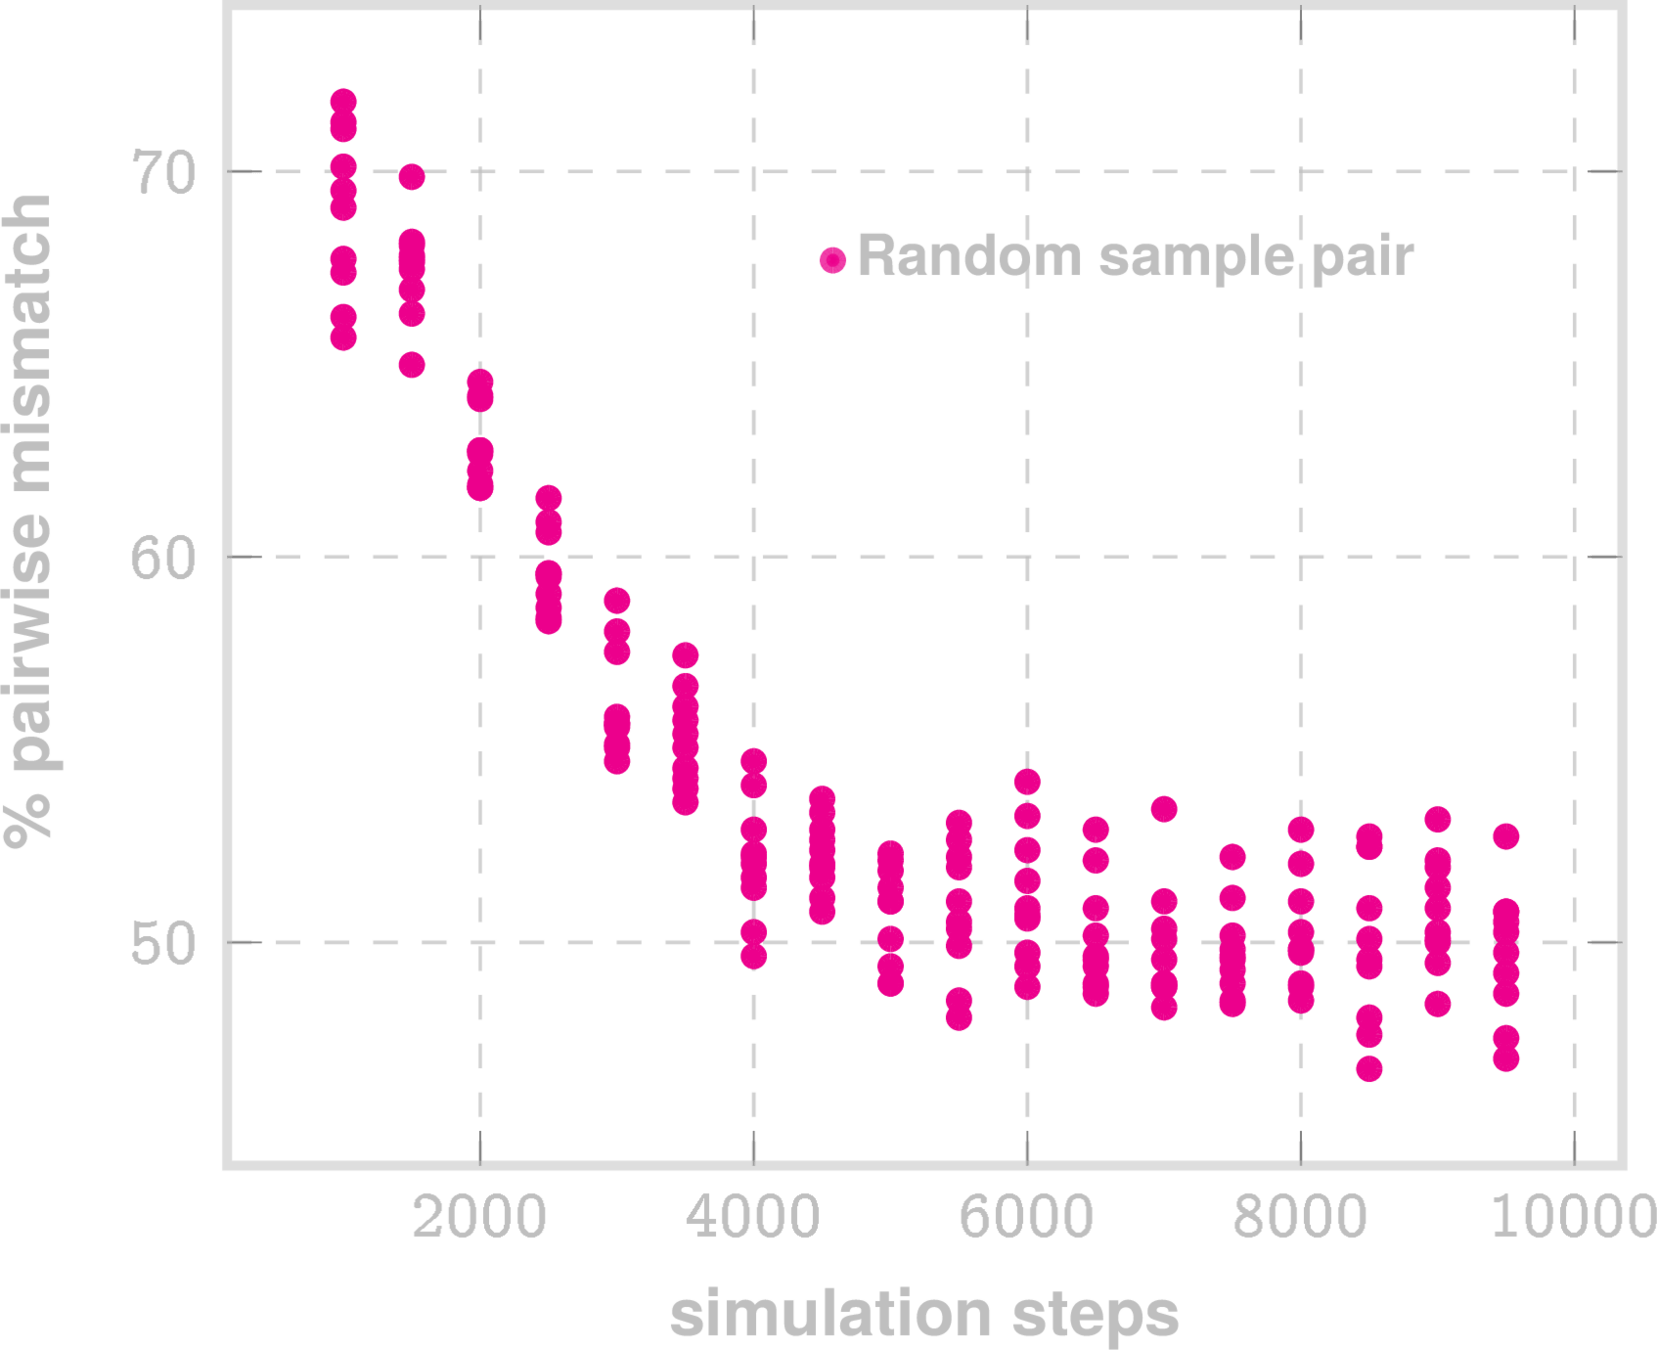
No Convergence
(~50% belief mismatch between pairs)
2018 GSS survey belief vectors simulated via LSM sampling
- No ergodicity assumption: LSMs are built for non-ergodic systems
- Sampling and simuation "remembers" the start point (No convergence), demonstrating non-ergodic learned structure
- Local potential fields vary across the space
- Potential wells may arise, driven by the dynamics at hand, not via assumptions
- "change" is driven by non-equilibrium (dissonance)
Embedded Social Theories in LSM
How LSMs reflect and operationalize foundational social-scientific ideas
-
Belief about topic iii is expected to align with beliefs about other topics \(\displaystyle\psi^{-i}\).
Deviations are exponentially improbable \(\Rightarrow \) people/groups seek internal coherence. -
Theory Link:
-
Cognitive consistency theory – Abelson et al. (1968)
-
Constraint satisfaction in beliefs – Read & Marcus-Newhall (1993)
-
-
Beliefs evolve to minimize tension between actual state and “expected” state.
Reflexive gradient flow — system reduces internal contradiction. -
Theory Link:
-
Cognitive Dissonance Theory – Festinger (1957)
-
Homeostatic belief adjustment – Gawronski & Strack (2004)
-
-
Observing a belief changes it and affects all conditionals.
Direct encoding of feedback loops central to human systems. -
Theory Link:
-
Reflexivity in social systems – Giddens (1984), Soros (1994)
-
Theory of mind / mutual modeling – Premack & Woodruff (1978)
-
Validation of Social Theory Questions:
\(\checkmark\) 7. Elaborate on Task 8, particularly how you will test "the ability to adjudicate competing social science theories."
\(\checkmark\) 3. Please clarify how social science theory is integrated into your model. Are theories integrated in some way, or is the model purely data-driven?
- Perception changes reality, which changes perception
- The Constitution of Society
- The Alchemy of Finance
- Does a chimpanzee have a theory of mind?
- Our system “wants” to reach a low-energy (low-dissonance) state — a direct computational analog of Festinger’s theory.
- People strive to align beliefs and attitudes across related domains. Inconsistencies create cognitive discomfort, prompting adjustments across belief clusters to restore harmony.
| Exploratory: Belief systems react measurably to exogenous events and shocks |
Exploratory: Cross-dependencies between beliefs have observable effects on societal resilience.
Is Polarization an Inevitable Attractor?
Social Identity Theory vs. Belief Proximity
Problem Focus
\(\checkmark\) 2. What specific topic(s) will proposer focus on? E.g. pandemic response hints at DoD-relevant topics but could be more specific.
A General Framework for modeling Complex Systems with Psycho-social Application
Survey Datasets (Public or available at nominal cost)
| Survey | Waves / Years | Avg Participants / Wave | Avg Questions / Wave | Participants (approx) | Data Source / Link |
|---|---|---|---|---|---|
| General Social Survey (GSS) | ~33 (1972–2024) | ~3,000 | ~1,500 | ~99,000 | NORC GSS Data Explorer |
| ANES | ~25 (election-year) | ~3,100 | ~1,000 | ~77,500 | ANES Data Portal |
| Cooperative Election Study (CES) | ~18 (2006–2024) | ~50,000 | ~200 | ~900,000 | CES Portal |
| Eurobarometer | ~100 (1973–2024, biannual) | ~30,000 | ~100 | ~3,000,000 | European Commission Archive |
| World Values Survey (WVS) | 7 waves (1981–2020) | ~2,000 / country | ~250 | ~1,120,000 | WVS Website |
| European Social Survey (ESS) | 10 waves (2002–2022) | ~2,500 / country | ~250 | ~750,000 | ESS Website |
| Latinobarómetro | ~25 waves (1995–2024) | ~18,000 | ~110 | ~450,000 | Latinobarómetro Archive |
| Afrobarometer | 6 rounds (1999–2022) | ~1,800 / country | ~120 | ~220,000 | Afrobarometer Archive |
| Arab Barometer | 5 waves (2006–2022) | ~1,800 / country | ~130 | ~135,000 | Arab Barometer Site |
| Asian Barometer | 4 waves (2001–2022) | ~1,500 / country | ~120 | ~108,000 | Asian Barometer Network |
Social Science
Physics
AI
Actionable Validated Theory of Social Dynamics from the individual to groups
DoD Applications: Reliable Forecasts of Human Behavior from Individuals to Collectives| Communication | De-Radicalization
Psychohistory*
*Asimov, I. (1951). Foundation. New York: Gnome Press.
Future
ARC
Forecast societal opinion shifts
Detect early polarization onset
Map ideological phase transitions
Tailor interventions to subgroups
Optimize persuasion at scale
Digital
Twins of belief systems /groups
Large Science Models: Broader Applications
\(\checkmark\) 9. Your use case focuses on information transmission through social systems. Could you discuss other potential applications or use cases for your approach? What kind of data would other applications require?
A General Framework for modeling Complex Systems
\(\checkmark\) 10. Discuss any limitations or challenges you anticipate in developing and implementing your LSM framework, and how you plan to address them.
Genomic database: Missing heritability problem
Personalized Clinical Digital Twin, Virtual Patients
Any structured interview, PTSD fabrication
Assess sysmptom data and co-pathologies
Predict future mutations; which animal strain is closest to jumping to humans
Mental health diagnosis
Microbiome Analysis**
Algorithmic lie detector
Viral emergence
Teomims
Opinion Dynamics
Darkome
Generative model of complex microbial ecosystems, and their impact on health and disease
Data requirements
- Tabular data
- Potentially large number of features/covariates (\(10^2 - 10^8 \))
- Sufficient number of samples (\(10^3 - 10^6\))
- Small number of longitudinal samples (currently, \( < 100\))
| Limitation | Mitigation / Response |
|---|---|
| Conventional time series is currently out-of-scope | Focus on cross-sectional interdependencies and belief geometry; time handled via drift |
| LSMs model statistical interdependence, not causal mechanisms | Use perturbation-based simulations to infer plausible influence pathways |
| Limited by observed belief variables | Integrate multiple surveys; use latent proxies and test sensitivity of digital twins |
| Social theory connections and interpretability may be challenging | Anchor dynamics with theory-driven constructs (e.g., ToM, cognitive dissonance) |
LSMs for complex systems
**preliminary study published (https://www.science.org/doi/10.1126/sciadv.adj0400)
Proposer Overview
PI: Ishanu Chattopadhyay, PhD
Assistant Professor of Biomedical Informatics & Computer Science
Associate Faculty Sanders-Brown Center of Aging
University of Kentucky
- PI on 4 past DARPA grants
- D3M (Data-driven Discovery of Models, I20, PM: Wade Shen)
- PAI (Physics of AI, DSO, PM: James Gimlett)
- PREEMPT (PREventing EMerging Pathogenic Threats, BTO, Site-PI, PM: James Gimlett)
- YFA 2020 (Topic: Cognitive Dissonance, PM: Bartlett Russell)
- High impact publications (https://scholar.google.com/citations?user=JpUbOmsAAAAJ&hl=en)
- Nature Human Behavior
- Science Advances
- Nature Communication
- PNAS
- Nature Medicine
- Funding from Alzheimer's Association, NIA
- Advised 3 Postdocs, 2 PhD, over 30 graduate and undergraduate students
- >40 Invited lectures including at NIH, DoD Facilities, National Labs
Staff Scientist (TBD) w expertise:
- ML/AI
- Stochastic processes
- Software Implementation in C++/Python
Existing PhD Student
(Not funded by ARC)
- ML/AI
- Stochastic processes
The computational facilities available to Biomedical informatics, CS at UKy, along with its research infrastructural support will ensure smooth execution.
Current members of the Chattopadhyay Lab (ZeDlab) will contribute to program success, while not being directly funded:
Other Support
Cost & Schedule
| Estimated costs | USD |
|---|---|
| Labor cost | 157,227.86 |
| Other direct costs | 9,993.00 |
| Total (direct+indirects for 12 months) | 257,520.12 |
Validation Plan Outline
Gantt Chart*
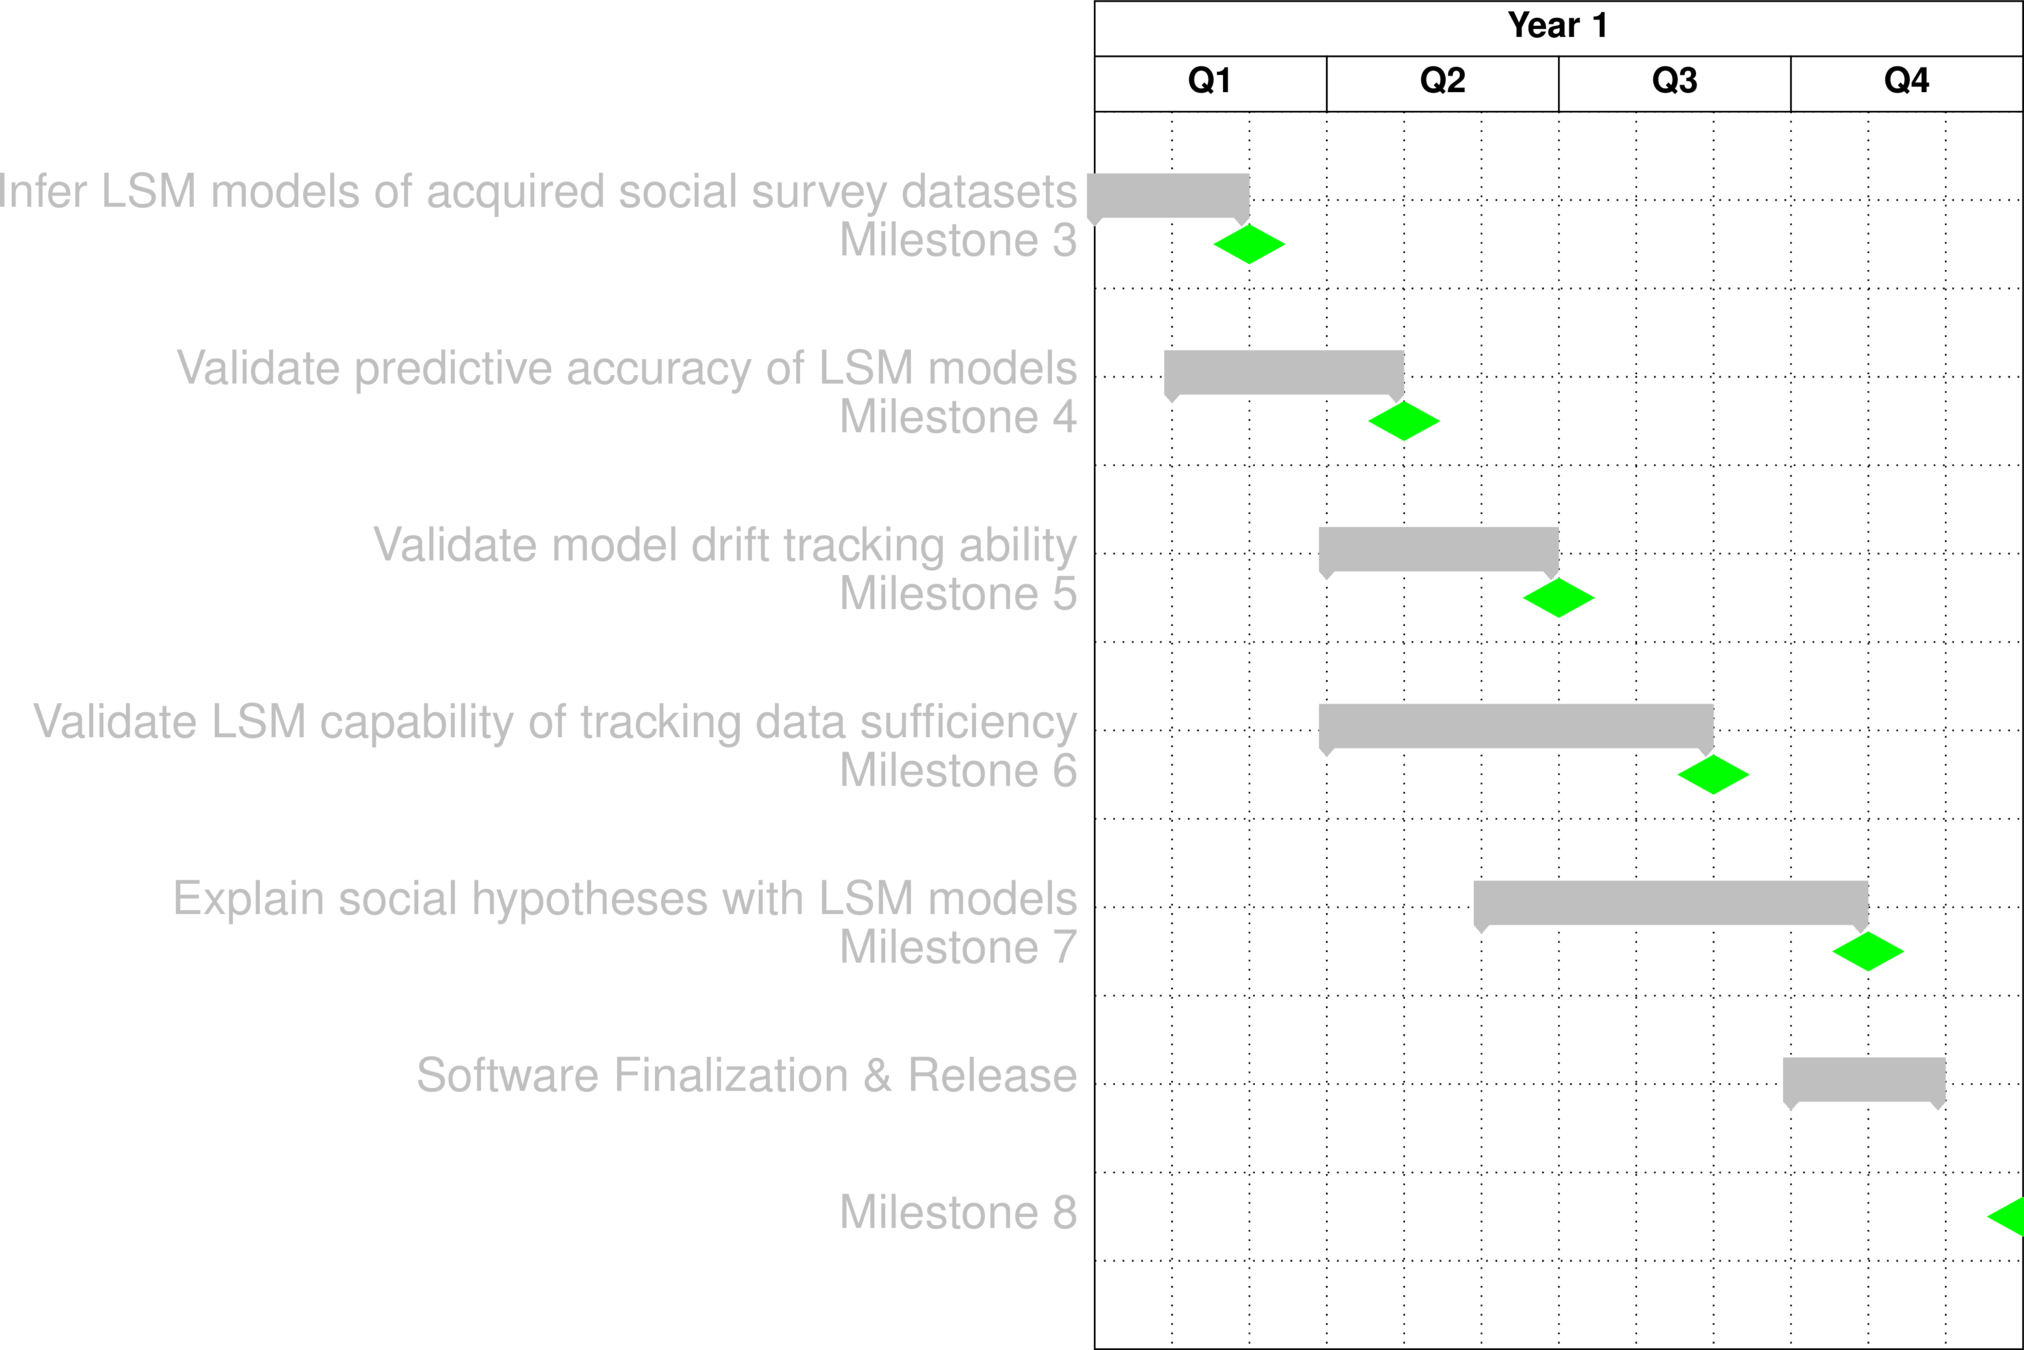
*Milestone definitions in next slide
Dataset Acquisition (10 survey datasets)
LSM inference
LSM predictive ability validation
LSM model drift sense validation
LSM data sufficiency tracking validation
LSM mediated social theory analysis
Milestones
| 1 | Kickoff Meeting: A briefing on the technical plan for the effort to include milestone schedule and path to accomplish the objectives of the agreement. | Government acceptance / Kickoff meeting briefing slides | Month 1 after award start |
| 2 | Validation plan: Detailed validation plan, including description,acquisition plan, and justification for the ground truth data, and description of the metricsand benchmarks to be used to measure performance. | Government acceptance / Technical report as described. | Month 1 |
| 3 |
Milestone Title: Dataset Acquisition and LSM Inference Technical goal: a) Dataset acquisition (10 social survey datasets acquired: GSS, ANES, CES, Eurobarometer etc) b) Infer LSM models for each dataset using 50% random samples, multiple LSMs trained with different random splits for each dataset. |
Government acceptance / Technical report detailing figure/code/data/etc. and all underlying materials generated in support of milestone, regardless of success | Month 2 |
| 4 |
Milestone Title: Masked sample reconstruction Technical goal: LSM predictive accuracy validation via censored sample reconstruction validation on out of sample data from each dataset, Demonstrate statistically significant reduction of LSM distance post reconstruction relative to post-masking. Target: Reconstruction metric error at least 50% improvement over 1) random imputation 2) median imputation |
Government acceptance / Technical report detailing figure/code/data/etc. and all underlying materials generated in support of milestone, regardless of success | Month 4 |
| 5 |
Milestone Title: Model drift sensing validation Technical goal: Demonstrate that LSM framework can reliably sense when underlying model drifts. Assess if the model drift statistic is stationary from samples drawn from the same survey wave of our datasets, and reliably indicates non-stationary drift for samples from different survey waves. Target: Model drift statistic must have statistical significance at 5% level for survey waves 5 years apart for at least GSS, CES and Eurobarometer Deliverable are detailed documentation on all 10 datasets |
Government acceptance / Technical report detailing figure/code/data/etc. and all underlying materials generated in support of milestone, regardless of success | Month 6 |
| 6 |
Milestone Title: Data sufficiency assessment capability Technical goal: Use the conservation of complexity principle to show that LSM framework can sense data deficiency and sufficiency. |
Government acceptance / Technical report detailing figure/code/data/etc. and all underlying materials generated in support of milestone, regardless of success.Analysis results on all 10 datasets | Month 8 |
| 7 |
Milestone Title: Social Theory and Competing Hypotheses Adjudication Technical goal: a) Social Theory Hypothesis Assessment: Polarization is an inevitable attractor b) Investigate the competing hypotheses that socio-economic identity vs belief proximity and latent opinion space geometry is more predictive of specific opinion / belief outcomes |
Government acceptance / Technical report detailing figure/code/data/etc. and all underlying materials generated in support of milestone, regardless of success | Month 10 |
| 8 |
Final milestone meeting and report (one month prior to award end date): The final briefing and final report should summarize all work completed on the project, highlighting accomplishments, lessons learned, unexpected outcomes, and challenges requiring further Research. Technical artifact delivery (Software release, evaluation results, source code, models, etc.) |
Government acceptance / Technical report as described.For software: Github repository with deployable code complete with example notebooks | Month 11 |
|
Milestone Title / Detailed Description |
|
Exit Criteria /Deliverable |
|
|
Milestone # |