


Content ITV PRO
This is Itvedant Content department
Design Data Model with Fact & Dimension Tables
Business Scenario
Welcome!
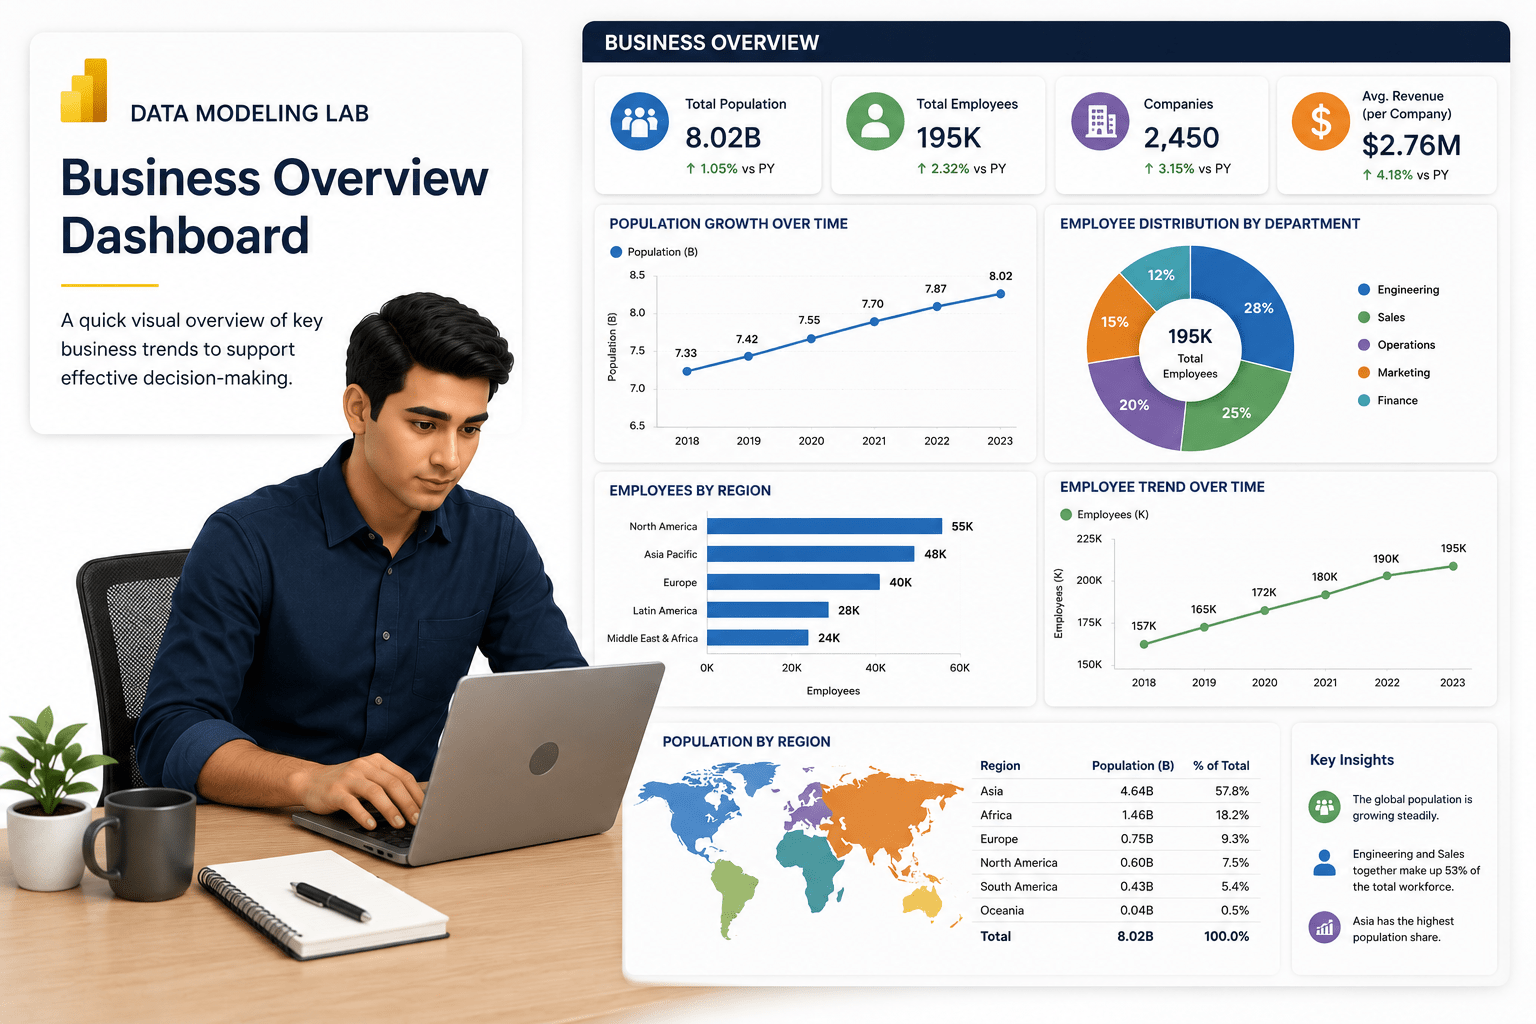
Management requires a quick visual overview of key business trends, such as population growth and employee distribution. Create appropriate charts and visualizations in Power BI to present the data clearly and support effective decision-making as part of the data modeling lab scenario.
Pre-Lab Preparation
Topic : Modelling Data in Power BI
1) Data Modelling
2) Different types of Schemas (Star and Snowflake)
3) Manage Data Relationships
Task 1: Identify fact and dimension tables
1
Task 2: Undersatnd Star schema and Snowflake schema
1
Task 3:
1
Great job!
Checkpoint
Next-Lab Preparation
Git Push
git push origin branchNameTopic :
1)
By Content ITV


