


Content ITV PRO
This is Itvedant Content department
Learning Outcome
3
Apply Mean Imputation for continuous variables (e.g., normalized-losses).
1
Identify non-standard missing values (like ?) in raw datasets.
2
Differentiate between standardizing data and imputing data.
4
Apply Mode Imputation for categorical variables (e.g., num-of-doors).
5
Judge when to drop data versus when to fix it.
Topic Name-Recall(Slide3)
Hook/Story/Analogy(Slide 4)
Transition from Analogy to Technical Concept(Slide 5)
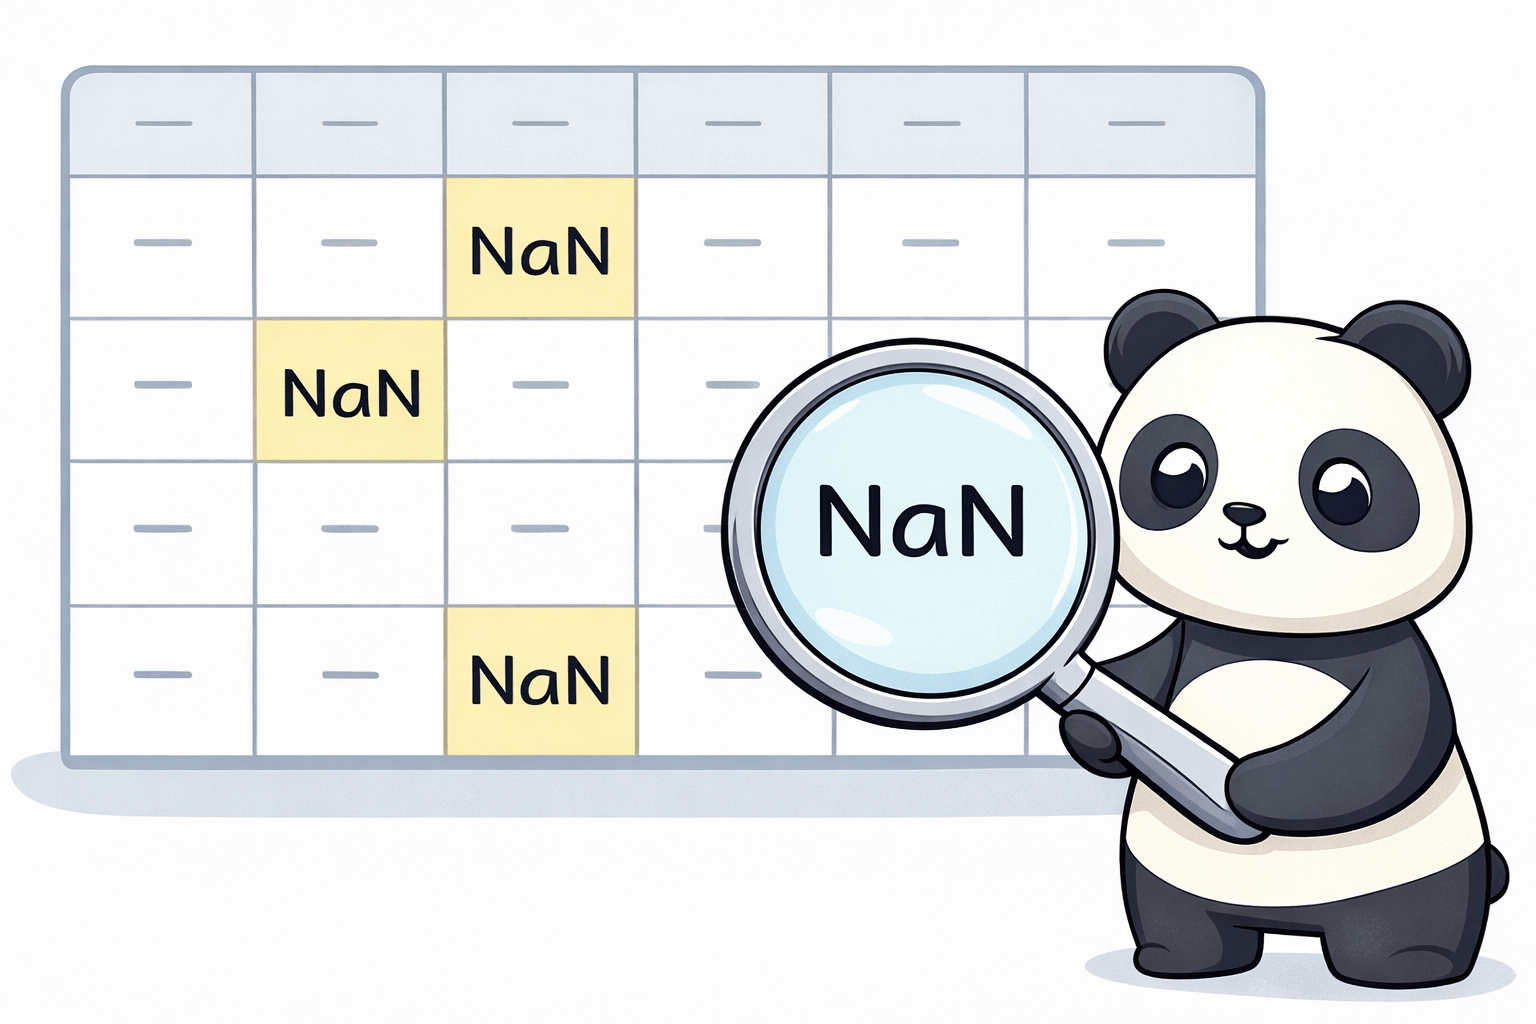
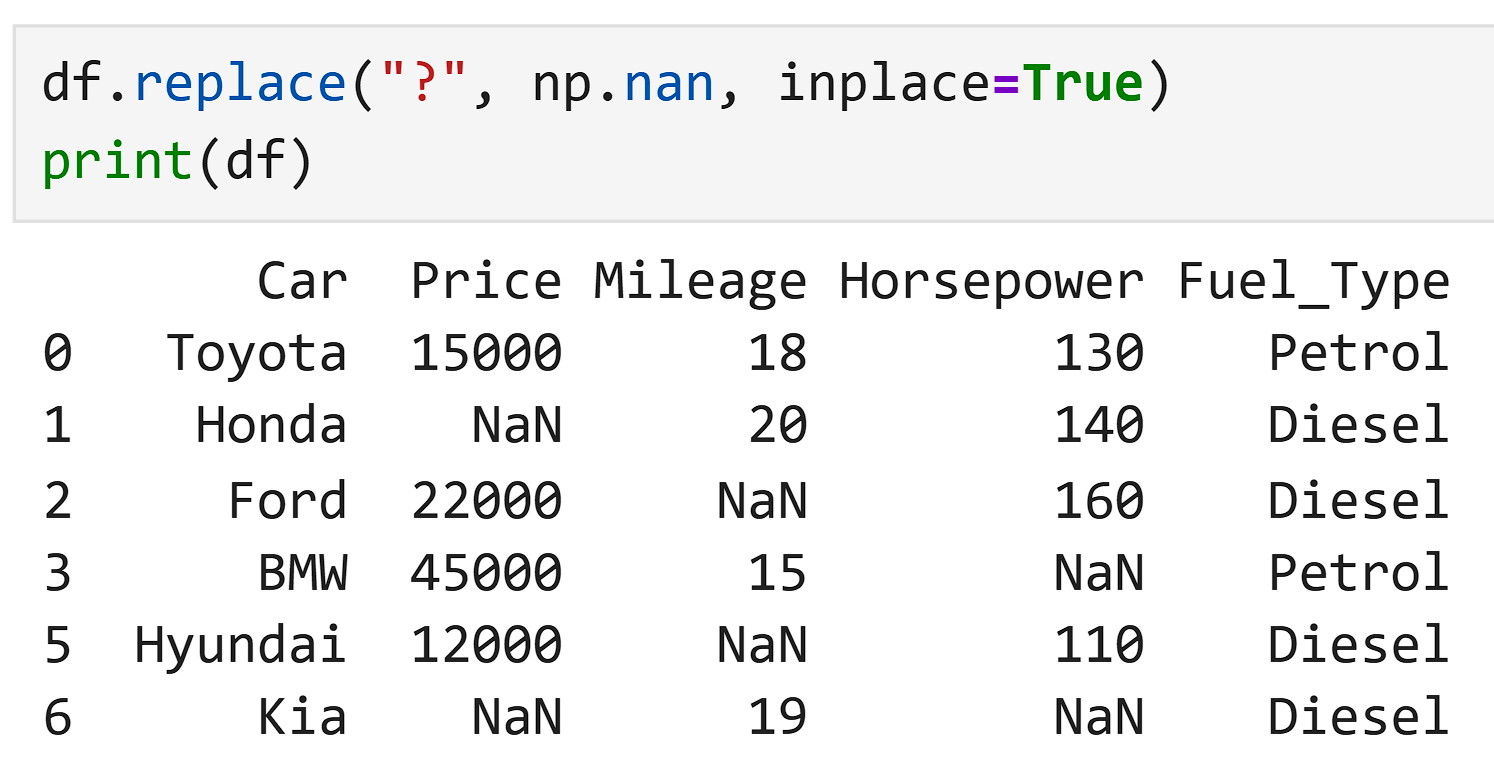
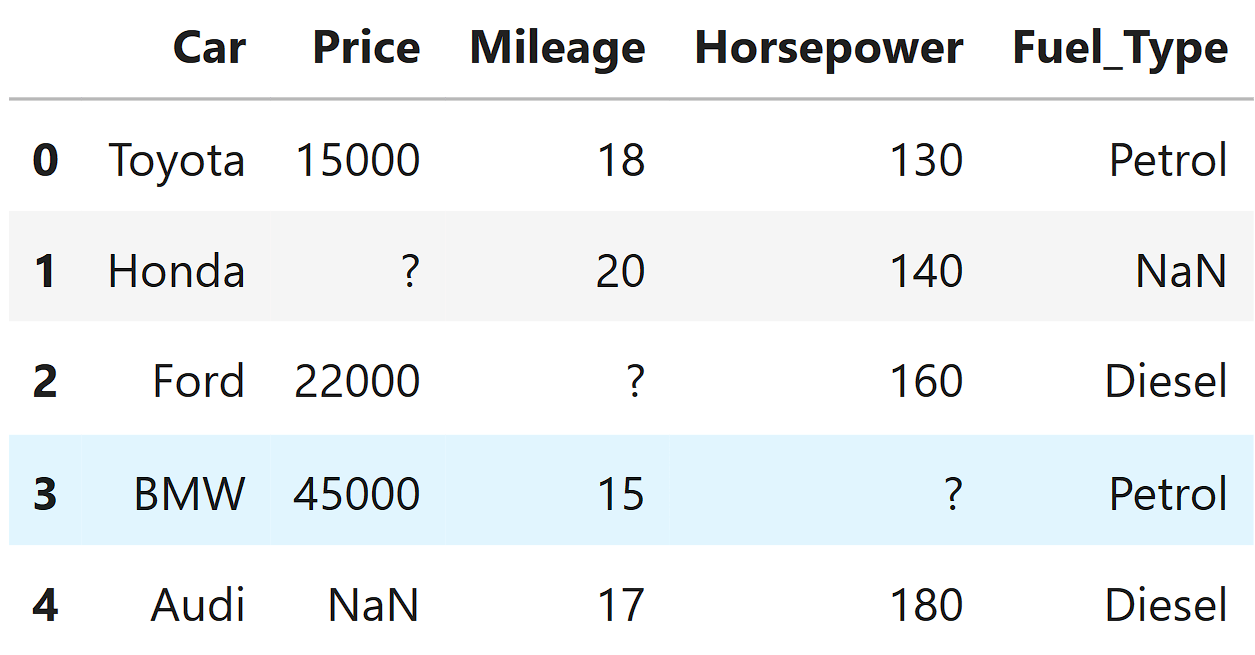
The "Hidden" Missing Data
In datasets, some values are missing.
Normally, missing values look like this:
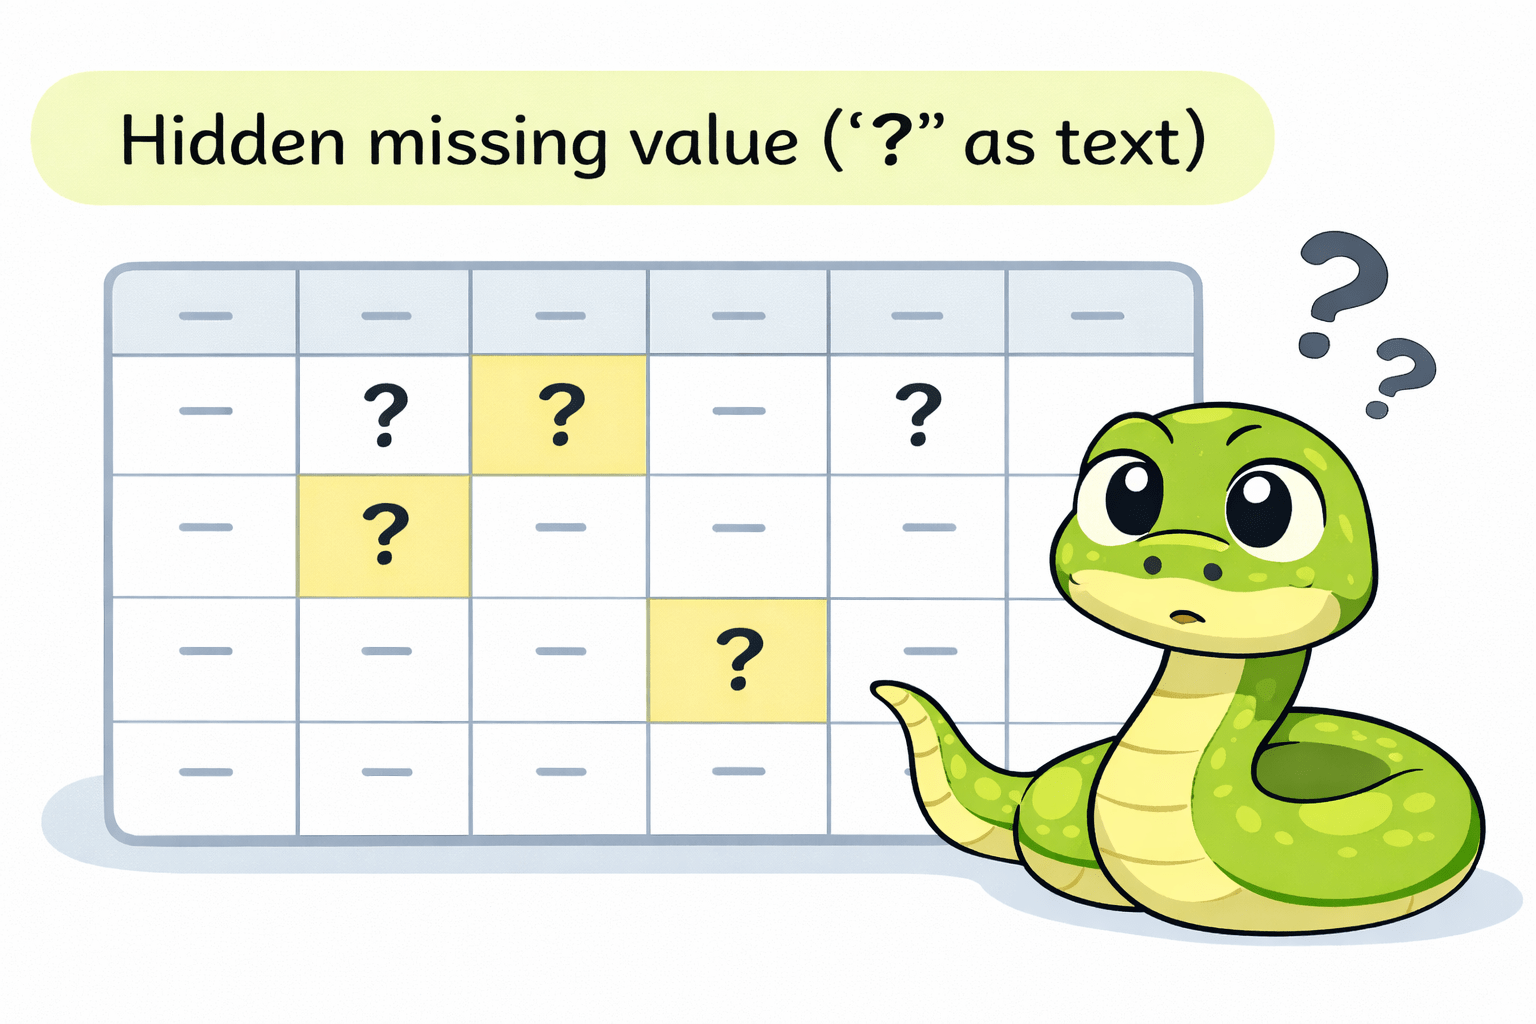
But in some datasets, missing values are written differently, like:
Python thinks this is just normal text, not a missing value.
Python will not treat it as missing unless we tell it to.
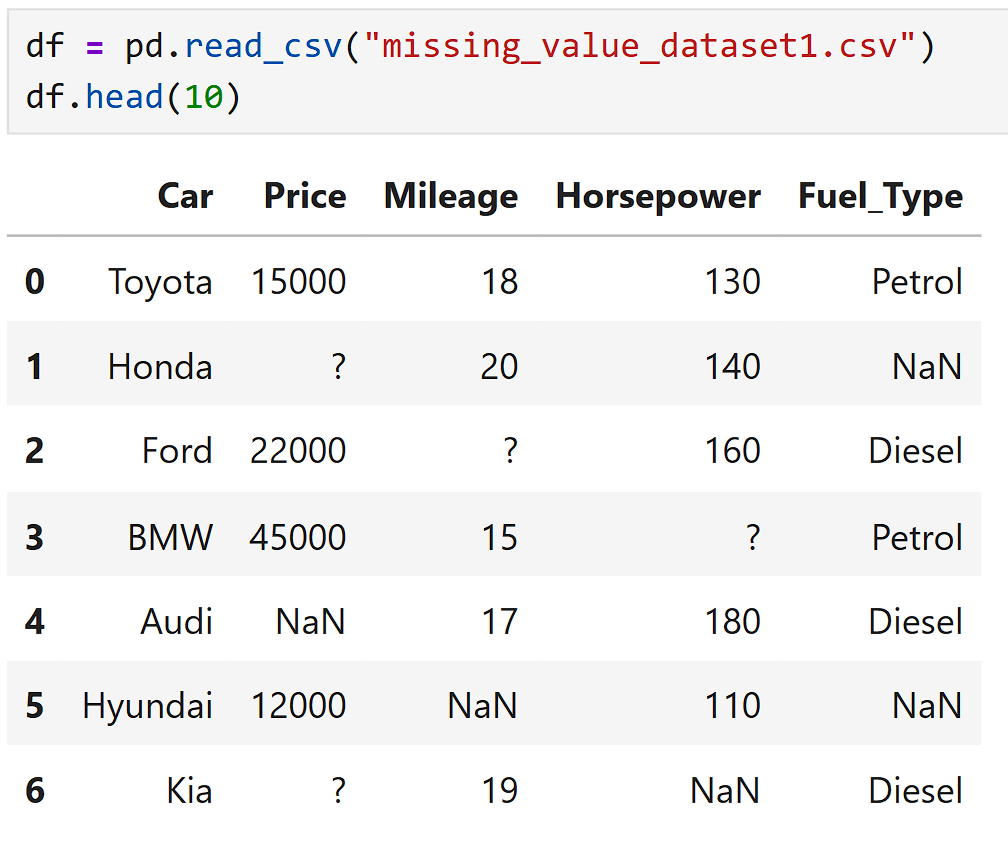
? (question mark)
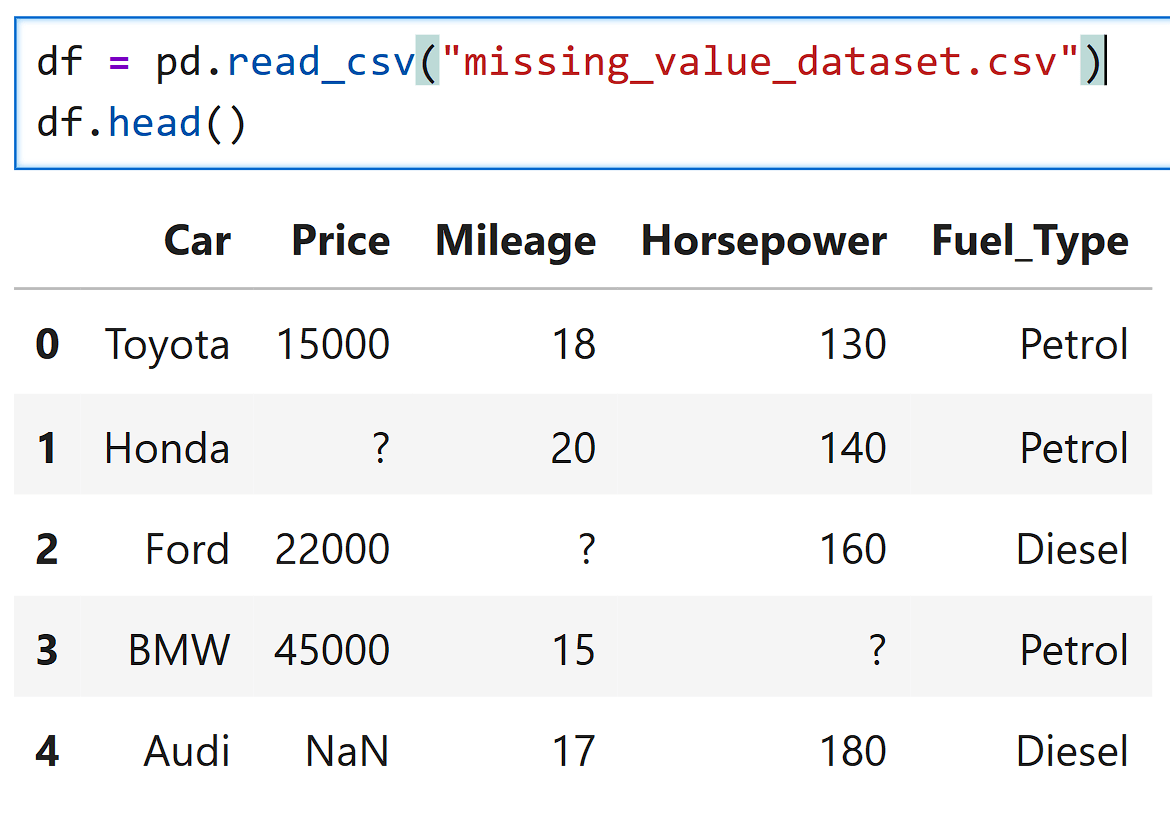
Key Idea :
In the file "missing_value_dataset.csv ", the missing values are written as :
So Python will not understand these as missing data by default.
We need to:
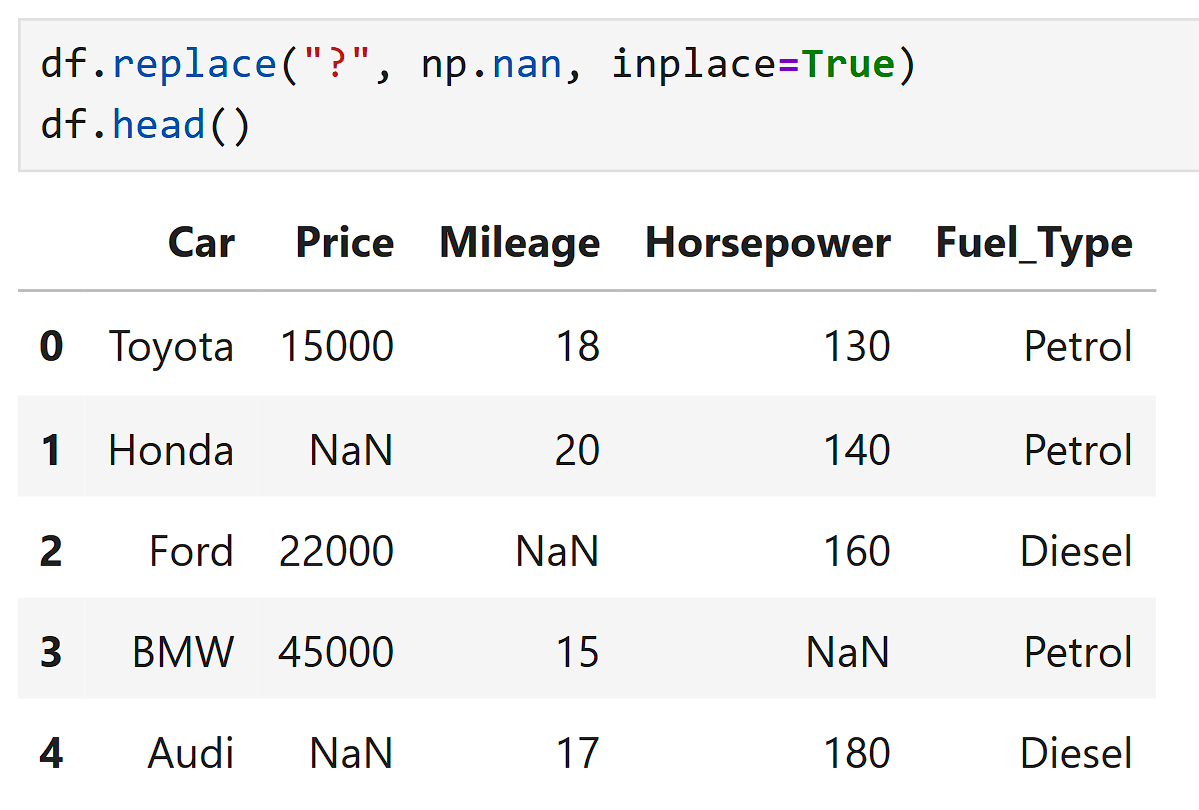
Convert them into NaN so Python can handle them properly.
The Strategy Map
When we find missing values in a dataset, we must decide:
What should we do with the empty or unknown data?
There are two main options.
Drop Data (The Nuclear Option)
Replace Data (Imputation)
Drop Data (The Nuclear Option)
This means removing data completely.
If a dataset has 1,000 rows and you drop 300 rows, you lose a lot of data.
Two ways to drop:
Drop the whole row
Drop the whole column
Example :
Replace Data (Imputation)
This means filling the missing values with something reasonable.
Common ways to replace:
Replace with Mean (Average)
Replace with Mode (Most Frequent)
Used for numeric data.
Used for categorical data (like color, fuel type).
Prices: 10, 20, 30, ?
Mean = (10+20+30)/3 = 20
Replace ? with 20
Fuel type: Petrol, Diesel, Petrol, ?
Mode = Petrol
Replace ? with Petrol
Example :
Example :
The Golden Rule:
If the Target (what we predict) is missing → DROP.
If a Feature (what we use to predict) is missing → IMPUTE.
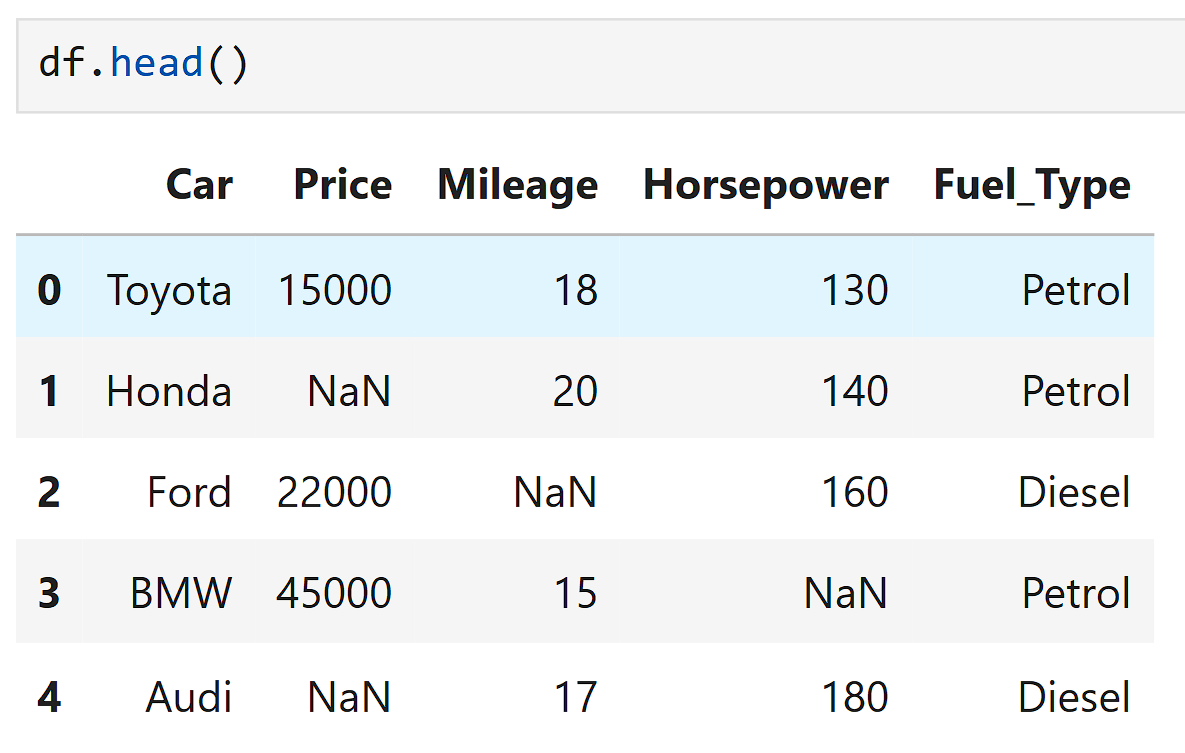
Imputing with Mean (Continuous Data)
The Price column in the dataset has missing values.
Some cells are empty (NaN).
This column contains numbers (car prices), not text.
So it is called continuous data.
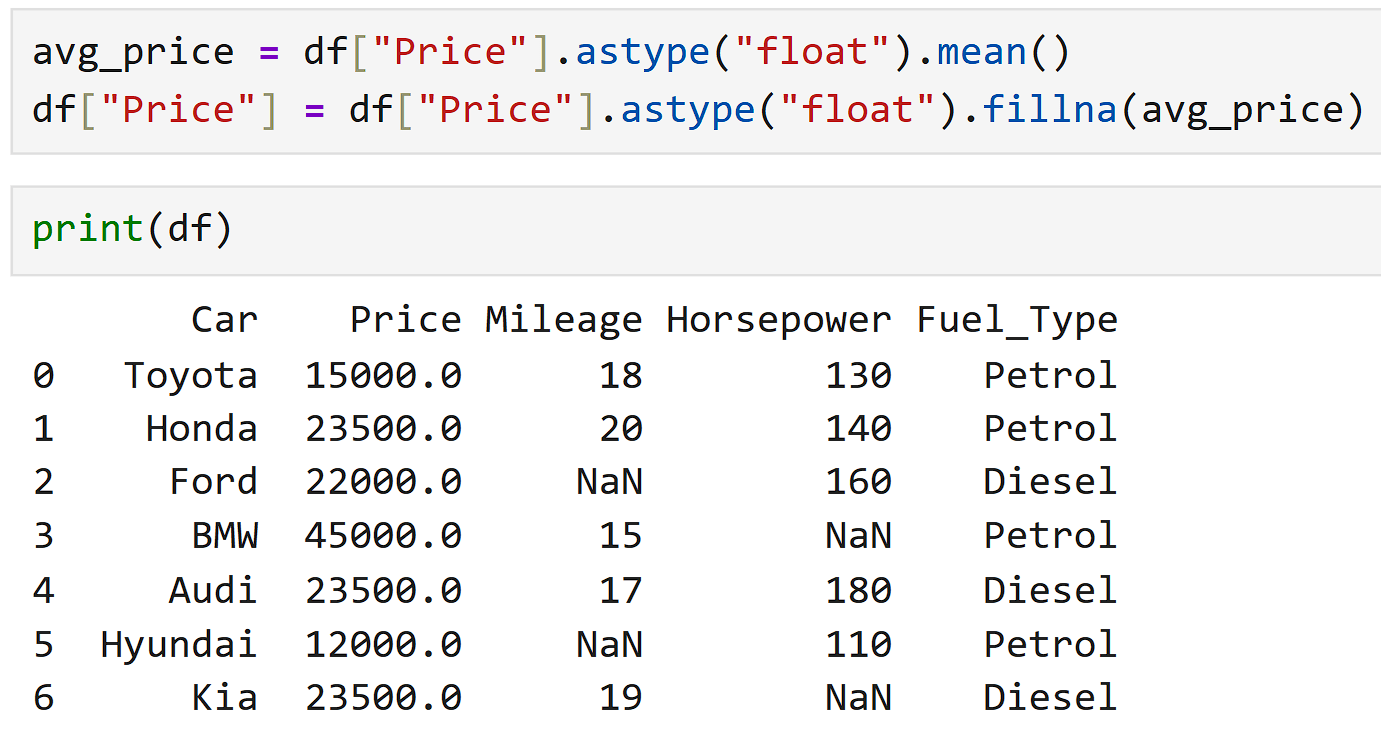
Instead of deleting the rows, we:
Fill the missing values with that average.
Why do we use the average?
The average represents the typical value of the column.
It is a safe and neutral guess.
It does not change the data too much.
So the overall pattern of the data remains balanced.
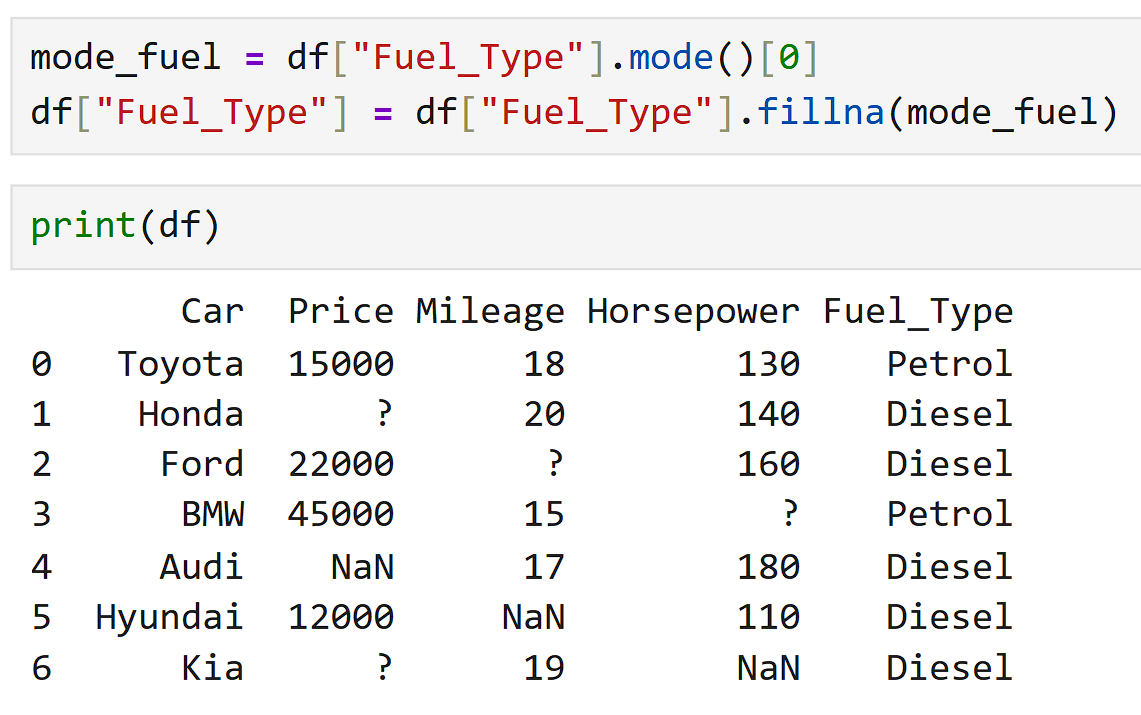
Imputing with Mode (Categorical Data)
So it is called categorical data.
The column Fuel_Type has missing values.
This column contains text categories, like:
Why we cannot use the average?
Fuel type is text, not numbers:
So average does not make sense for text data
Instead of the average, we use the mode.
Mode = the most common value in the column.
Counts:
Petrol → 2 times
Diesel → 3 times
Mode = Diesel
So we replace the missing value with Diesel.
Petrol , ? , Diesel , Petrol , Diesel , ? , Diesel
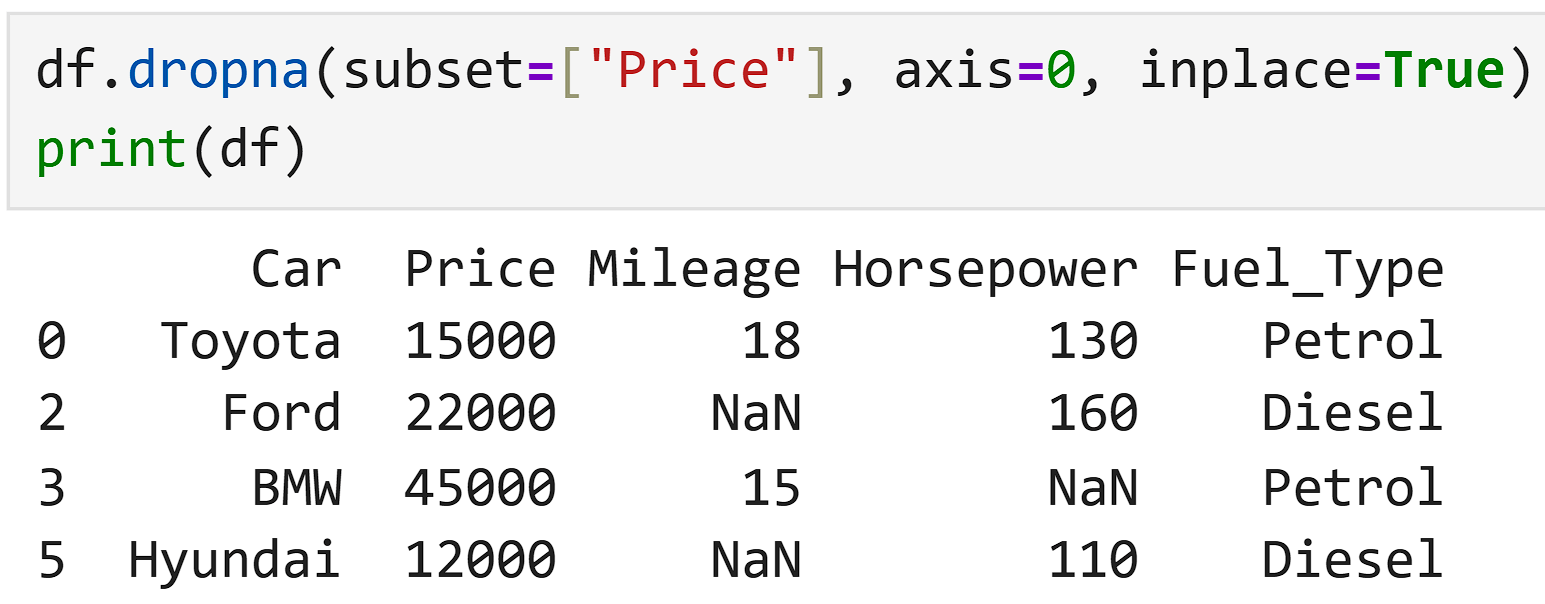
When to Drop
Target = the value we want the model to predict.
The column Fuel_Type has missing values.The price column has some missing values.
But price is the target variable.
If we want to build a model to predict car price, then price is the answer.
If the price is missing, we have two choices:
Fill it with an average or guess.
Remove that row.
If we fill it with a guess, we are giving the model a fake answer.
That is like:
So the model will learn incorrect patterns.
Never guess the target value.
So:
If target is missing → drop the row.
If we fill Honda’s price with an average, it becomes a fake value.
So we remove that row.
After dropping:
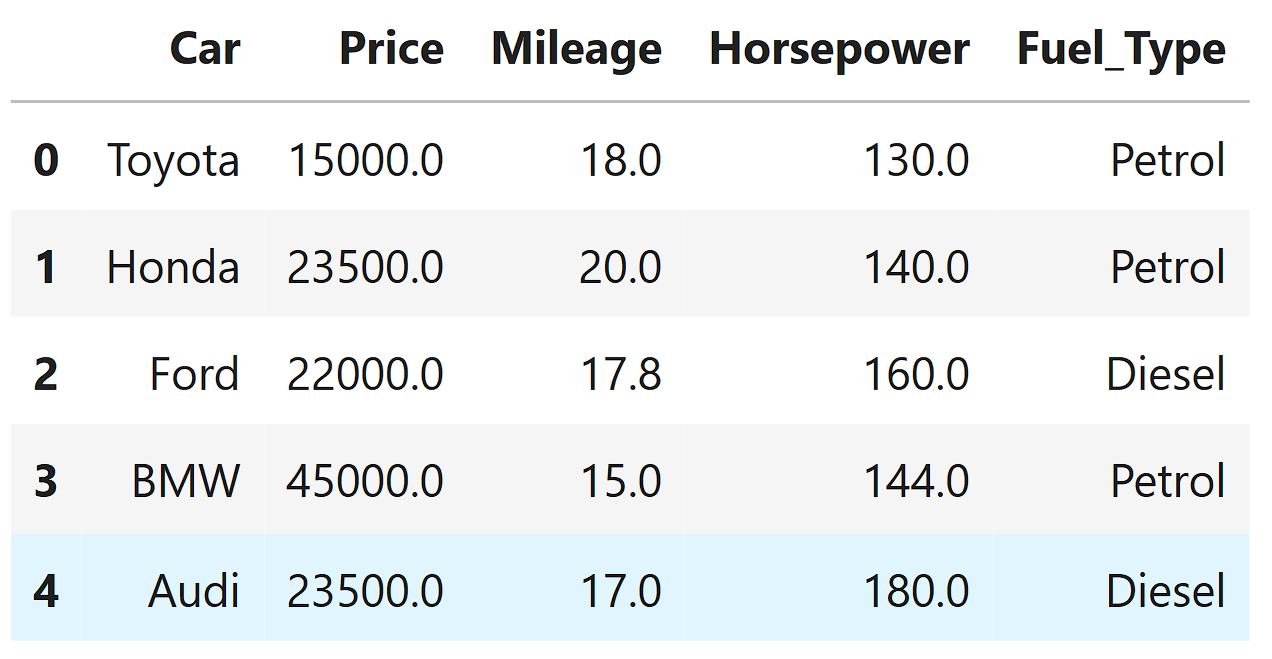
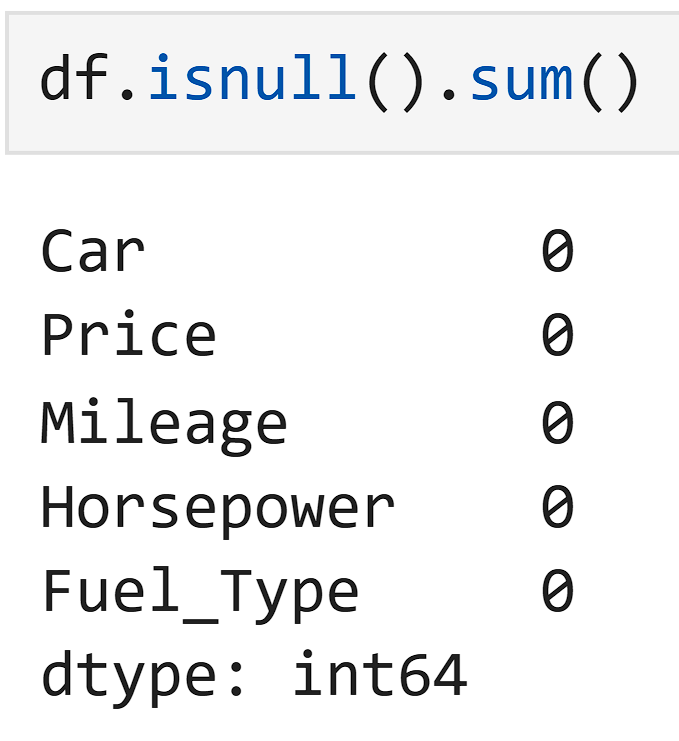
Visualizing the Transformation
Some columns in the dataset have missing values.
Price → 1 missing values
Mileage → 1 missing values
horsepower → 1 missing values
So the data has holes in important columns.
Because of this:
We fix the missing values using mean imputation.
Convert ? into real missing values
Fill numeric columns with mean
Now check missing values:
No NaN or ? values.
Data is now "Model Ready."
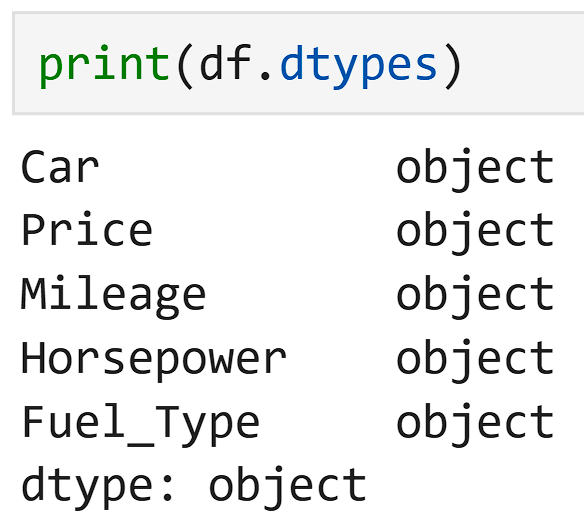
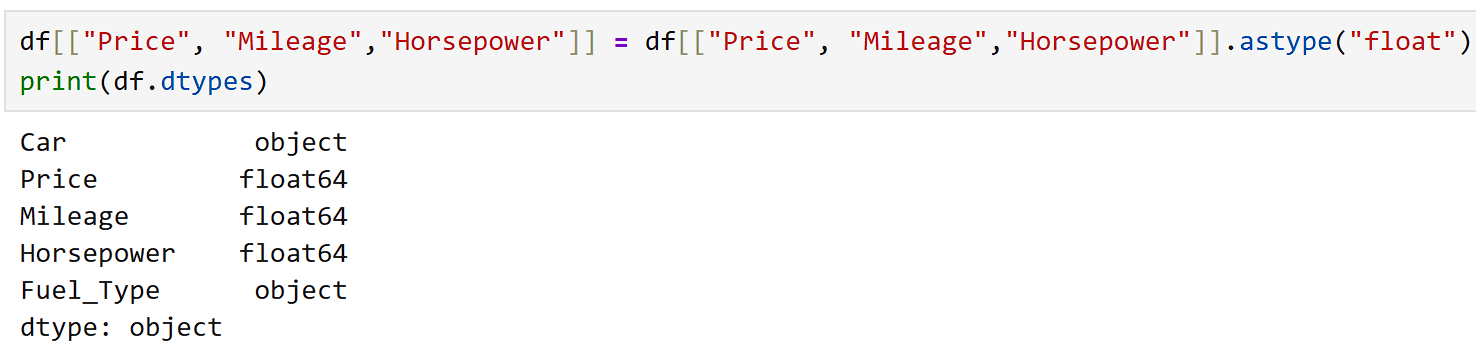
Correcting Data Formats
Just filling holes isn't enough.
The dataset may still have a problem.
are still stored as text (object type) instead of numbers.
Summary
5
Build strong branding
4
Use different marketing channels
3
Target the right audience
2
Create and communicate value
1
Understand customer needs
Choose cool, soft colors instead of vibrant colors
Max 5 Points for Summary & Min 2
Quiz
Which platform is mainly used for professional networking and B2B marketing ?
A. Facebook
B. Instagram
C. LinkedIn
D. Snapchat
Quiz-Answer
Which platform is mainly used for professional networking and B2B marketing ?
A. Facebook
B. Instagram
C. LinkedIn
D. Snapchat
By Content ITV


