


Content ITV PRO
This is Itvedant Content department
Apply Regularization Techniques (Lasso & Ridge)
Business Scenario
Welcome back!
Today is your sixth day as a Junior Data Scientist at AutoVision Analytics.
Yesterday, you successfully evaluated the Vehicle Price Prediction Model using regression metrics such as MAE, MSE, and R² Score. The management team was satisfied with the initial results but believes that the model can be further improved before deployment.
After reviewing the evaluation report, the Senior Data Scientist pointed out that although the model performs well on the current dataset, it may not generalize equally well to unseen data. Therefore, the team has decided to optimize the model using Regularization Techniques.
Your manager has assigned you the responsibility of applying Ridge Regression and Lasso Regression, comparing their performance with the existing Linear Regression model, and recommending the best approach for deployment.
Pre-Lab Preparation
Topic : Supervised Learning – Regression
1) Regularisation ,Lasso & Ridge
git pull origin branchNameGit Pull
Task 1: Understanding BRD
The management team is concerned that although the current model performs well on the available data, it may not perform equally well when predicting prices for new vehicles.
As a Junior Data Scientist, your first responsibility is to understand why this happens and how Regularization can help improve model performance.
Since the Vehicle Price Prediction Model has already been built and evaluated, continue working in the same notebook.
Click to download previous file : ML Lab 5.ipynb
Overfitting
Overfitting occurs when a Machine Learning model learns not only the actual patterns in the training data but also the noise present in it. As a result, the model performs well on training data but poorly on unseen data.
Underfitting
Underfitting occurs when a model is too simple to capture the underlying relationships in the data. Such a model performs poorly on both training and testing datasets.
Regularization
Regularization is a technique used to reduce model complexity by adding a penalty to large coefficients. It helps prevent overfitting and improves the model's ability to generalize to new data.
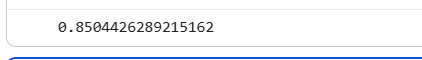
Check the training score on training data
1
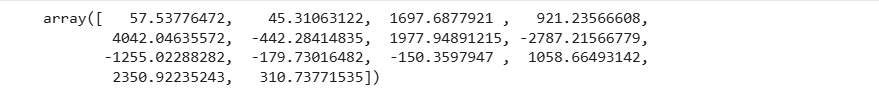
lr.score(X_train,Y_train)Check slope or coefficient of each input , use inbuilt method coef_
2
lr.coef_Check testing score with 30% data
3
lr.score(X_test,Y_test)Training score =0.85 and testing score = 0.79, here the model is overfit because training score >testing score
4
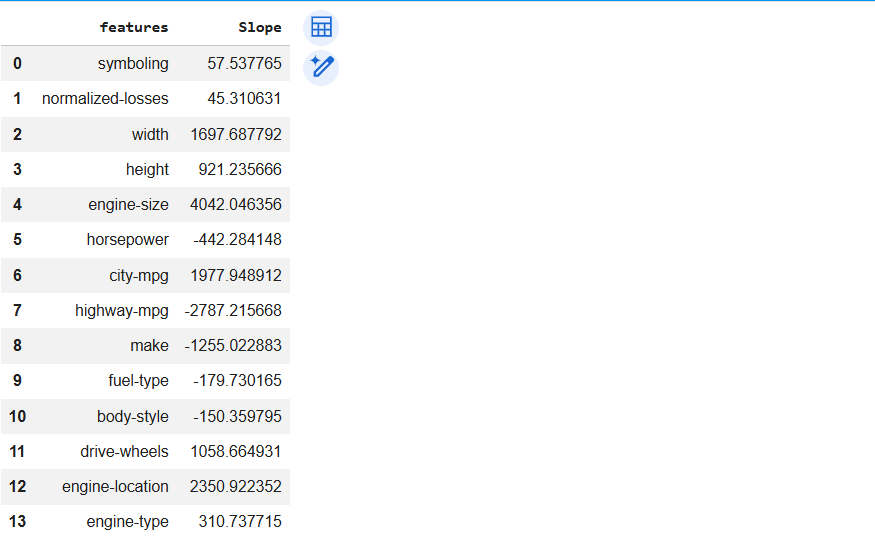
Create a dictionary which hold input column and coefficient of input
dict={'features':X.columns,'Slope':lr.coef_}
df1=pd.DataFrame(dict)
df1
Task 2: Apply Lasso Regression
The management team now wants to determine whether the model can be further optimized by automatically identifying less important features.
The Senior Data Scientist has suggested applying Lasso Regression, which not only reduces overfitting but can also perform feature selection by shrinking some coefficients to zero.
Your responsibility is to build a Lasso Regression model and evaluate its performance.
Lasso Regression (L1 Regularization)
Lasso Regression is a Regularization technique that adds a penalty to the model coefficients.
Unlike Ridge Regression, Lasso Regression can reduce some coefficients to exactly zero, effectively removing less important features from the model.
This helps:
The amount of penalty is controlled by the Alpha (α) parameter.
Call inbuilt class Lasso
1
from sklearn.linear_model import Lasso2
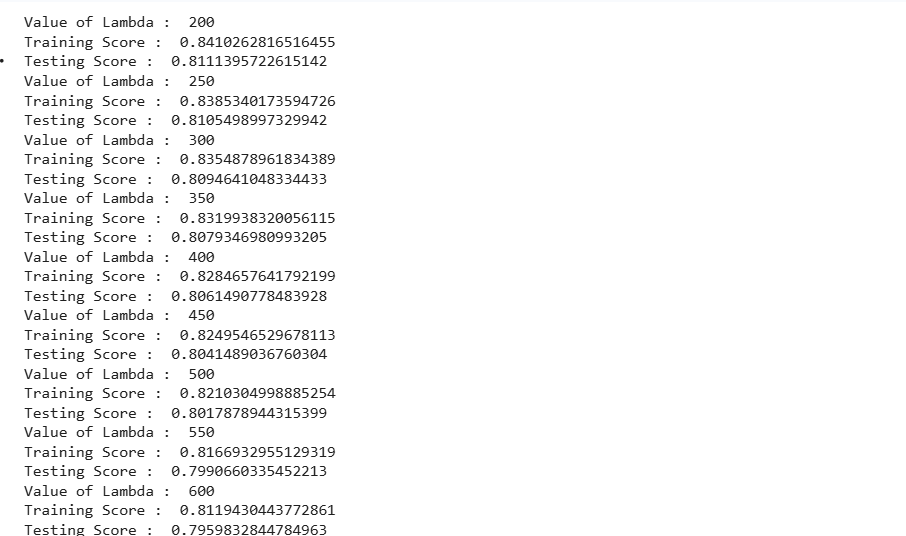
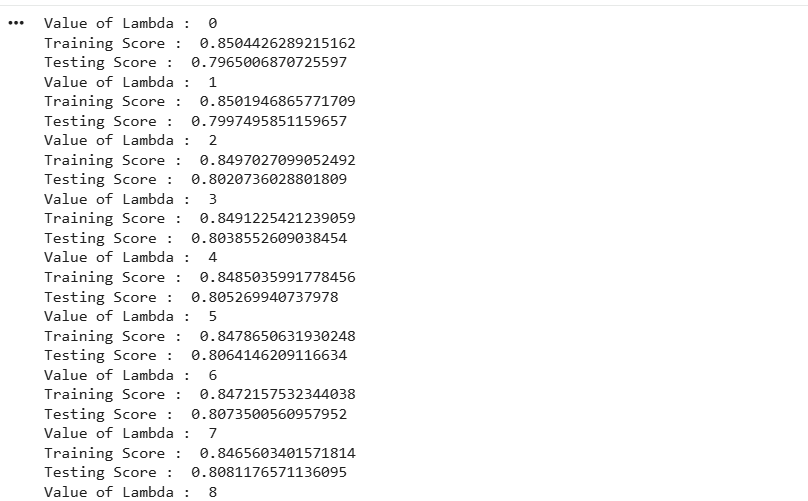
Select the right value of lambda /alpha in lasso, use simple technique
for i in range(200,1001,50): #start=200 stop=1001-1=1000 step=+50
    #create the object of Lasso class , passing the value of lambda
    l1=Lasso(i) #first i=200 , next i=250 ......
    #automatic write formula RSS+i*sum(abs(all coef))
    #train the model with 70% data using Lasso class , use fit() inbuilt
    #method of Lasso class
    l1.fit(X_train,Y_train)
    print("Value of Lambda : ",i)
    #check training score
    print("Training Score : ",l1.score(X_train,Y_train))
    #check testing score
    print("Testing Score : ",l1.score(X_test,Y_test))
3
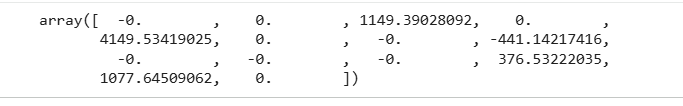
Check coefficient /slope of each input/features after apply lasso
Right value of Lambda in the case of Lasso =200
score got 81% and model is not overfit because training score=84%
l1.coef_4
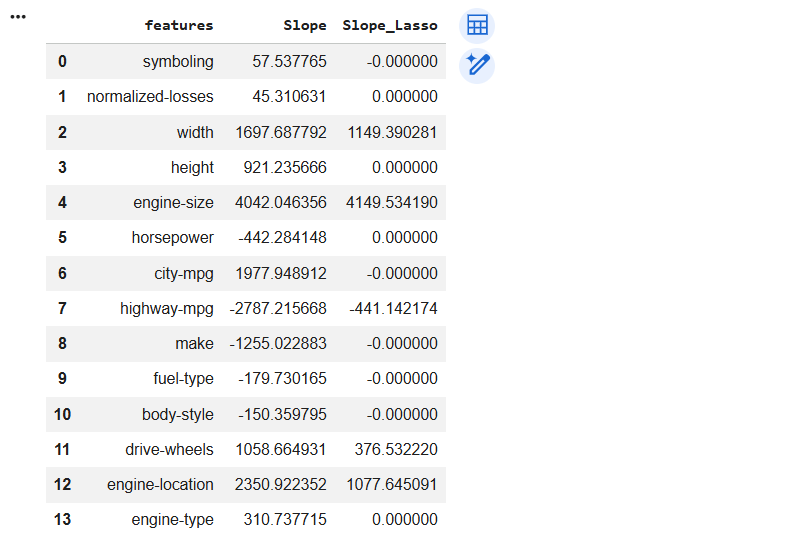
Add new column of slope in existing dataframe df1 after apply Lasso
df1['Slope_Lasso']=l1.coef_
df1
Y_pred=m1*X1+m2*X2+..........mn*Xn+C
Lasso use to select important features from given dataset
Lasso is a features selection method.
5
Create the Lasso Regression Model
lasso_model = Lasso(alpha= 200)6
Train the Model
lasso_model.fit(X_train, Y_train)7
Generate Predictions
lasso_pred = lasso_model.predict(X_test)8
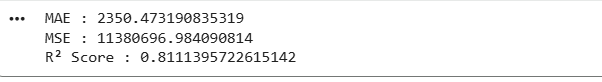
Create the Lasso Regression Model
from sklearn.metrics import mean_absolute_error, mean_squared_error, r2_score
print("MAE :", mean_absolute_error(Y_test, lasso_pred))
print("MSE :", mean_squared_error(Y_test, lasso_pred))
print("R² Score :", r2_score(Y_test, lasso_pred))
Task 3: Apply Ridge Regression
The Senior Data Scientist has suggested trying Ridge Regression, which reduces overfitting while retaining all the important features in the model.
Your task is to build and evaluate a Ridge Regression model using the existing training and testing datasets.
Ridge Regression (L2 Regularization)
Ridge Regression is an extension of Linear Regression that adds a penalty to large coefficient values.
Unlike Lasso Regression, Ridge Regression reduces the magnitude of coefficients but does not remove any features from the model.
The amount of penalty is controlled by a parameter called Alpha (α).
1
Call Ridge class inbuilt class
from sklearn.linear_model import Ridge2
Find range of lambda 0-50
for i in range(0,51): #start=0 stop=51-1=50 step=+1
    #create the object of Ridge means L2 and passing the value of lambda
    l2=Ridge(i)
    #train the model with 70% data using Ridge class , use fit() inbuilt
    #method of Ridge class
    l2.fit(X_train,Y_train)
    print("Value of Lambda : ",i)
    #check training score
    print("Training Score : ",l2.score(X_train,Y_train))
    #check testing score
    print("Testing Score : ",l2.score(X_test,Y_test))
Right value of lambda in Ridge : 12
Got testing score =81% and training score=84% means model is not overfit
3
Check coefficient after apply Ridge
l2.coef_df1['Slope_Ridge']=l2.coef_
df14
Create the Ridge Regression Model
ridge_model = Ridge(alpha= 12)5
Train the Model
ridge_model.fit(X_train, Y_train)6
Generate Predictions
ridge_pred = ridge_model.predict(X_test)7
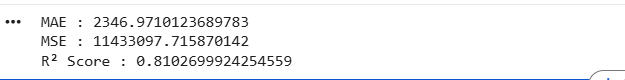
Evaluate the Ridge Model
from sklearn.metrics import mean_absolute_error, mean_squared_error, r2_score
print("MAE :", mean_absolute_error(Y_test, ridge_pred))
print("MSE :", mean_squared_error(Y_test, ridge_pred))
print("R² Score :", r2_score(Y_test, ridge_pred))
Task 4: Compare All Three Models
The management team has received the evaluation reports for Linear Regression, Ridge Regression, and Lasso Regression.
Before selecting a model for deployment, they want a comparative analysis of all three models.
Your task is to compare the models based on their evaluation metrics and overall behavior.
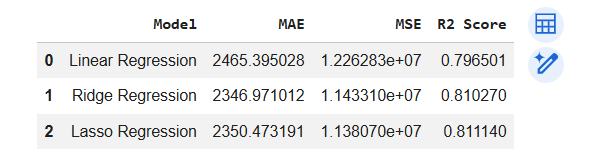
Create a Comparison Table
1
comparison = pd.DataFrame({
    "Model": [
        "Linear Regression",
        "Ridge Regression",
        "Lasso Regression"
    ],
    "MAE": [
        2465.395028223579,
        2346.9710123689783,
        2350.473190835319
    ],
    "MSE": [
        12262833.694863686,
        11433097.715870142,
        11380696.984090814
    ],
    "R2 Score": [
        0.7965006870725597,
        0.8102699924254559,
        0.8111395722615142
    ]
})

# Display the comparison table
comparison
Task 5: Business Recommendation
The management team has reviewed the performance of the three regression models and has asked you to recommend the most suitable model for deployment in the Vehicle Price Prediction System.
Based on the evaluation metrics:
It is observed that Ridge Regression and Lasso Regression outperform the basic Linear Regression model. Among them, Lasso Regression achieves the highest R² Score and the lowest MSE, while also performing feature selection by reducing less important coefficients.
Great job!
You have successfully completed Lab 6: Apply Regularization Techniques (Lasso & Ridge).
Checkpoint
In this lab, you understood the concepts of Overfitting, Underfitting, and Regularization, applied Ridge Regression and Lasso Regression models, and evaluated their performance using MAE, MSE, and R² Score. You compared these models with the existing Linear Regression model and identified the most suitable approach for improving the Vehicle Price Prediction System.
Your analysis has helped the Data Science team optimize the model for better generalization and prepare it for real-world deployment.
You are now ready to move to the next stage of the Automobile Intelligence Project.
Git Push
git push origin branchNameNext-Lab Preparation
Topic : Supervised Learning – Classification
1) Logistic Regression (Customer Churn using classification models)
By Content ITV


