Engineer Features for Better Model Performance

Business Scenario
Welcome back!
Today is your third day as a Junior Data Scientist at AutoVision Analytics.
Yesterday, you prepared the automobile dataset for Machine Learning by identifying the target variable, exploring dataset features, handling missing values, removing duplicate records, and encoding categorical variables.
The Data Science team is now ready to move beyond basic preprocessing. Your manager has assigned you the responsibility of identifying the most influential features, engineering new features, and preparing the data for model training.

By the end of the day, you should be able to improve the quality of the dataset and provide recommendations on which features should be used for building the Vehicle Price Prediction System.
Pre-Lab Preparation
Topic : EDA - Automobile Data
1) Data Scaling & Normalization (Min-Max, Standardization)
2) Feature Selection & Feature Engineering
3) Handling Imbalanced Data (SMOTE, Undersampling, Oversampling)
git pull origin branchName
Git Pull
Task 1: Identify Important Features for Vehicle Pricing
The management team wants to understand which vehicle characteristics have the greatest impact on vehicle prices.
Before building a Machine Learning model, Data Scientists identify relationships between features and the target variable.
Your task is to analyze feature relationships and determine which features contribute most to vehicle pricing.
Correlation Analysis
Correlation measures the strength of the relationship between two variables.
Correlation values range from:

| Value | Interpretation |
|---|---|
| +1 | Strong Positive Relationship |
| 0 | No Relationship |
| -1 | Strong Negative Relationship |
Features with stronger correlations often provide more predictive power.
Open Google Colab file
1
Click to download previous file : Automobile_model.ipynb
Generate Correlation Matrix
2
df.corr(numeric_only=True)Visualize Correlation Using Heatmap
3
plt.figure(figsize=(20,15))
sns.heatmap(
    df.corr(numeric_only=True),
    annot=True,
    fmt='.2f',
    cmap='coolwarm'
)
plt.xticks(rotation=90)
plt.yticks(rotation=0)
plt.show()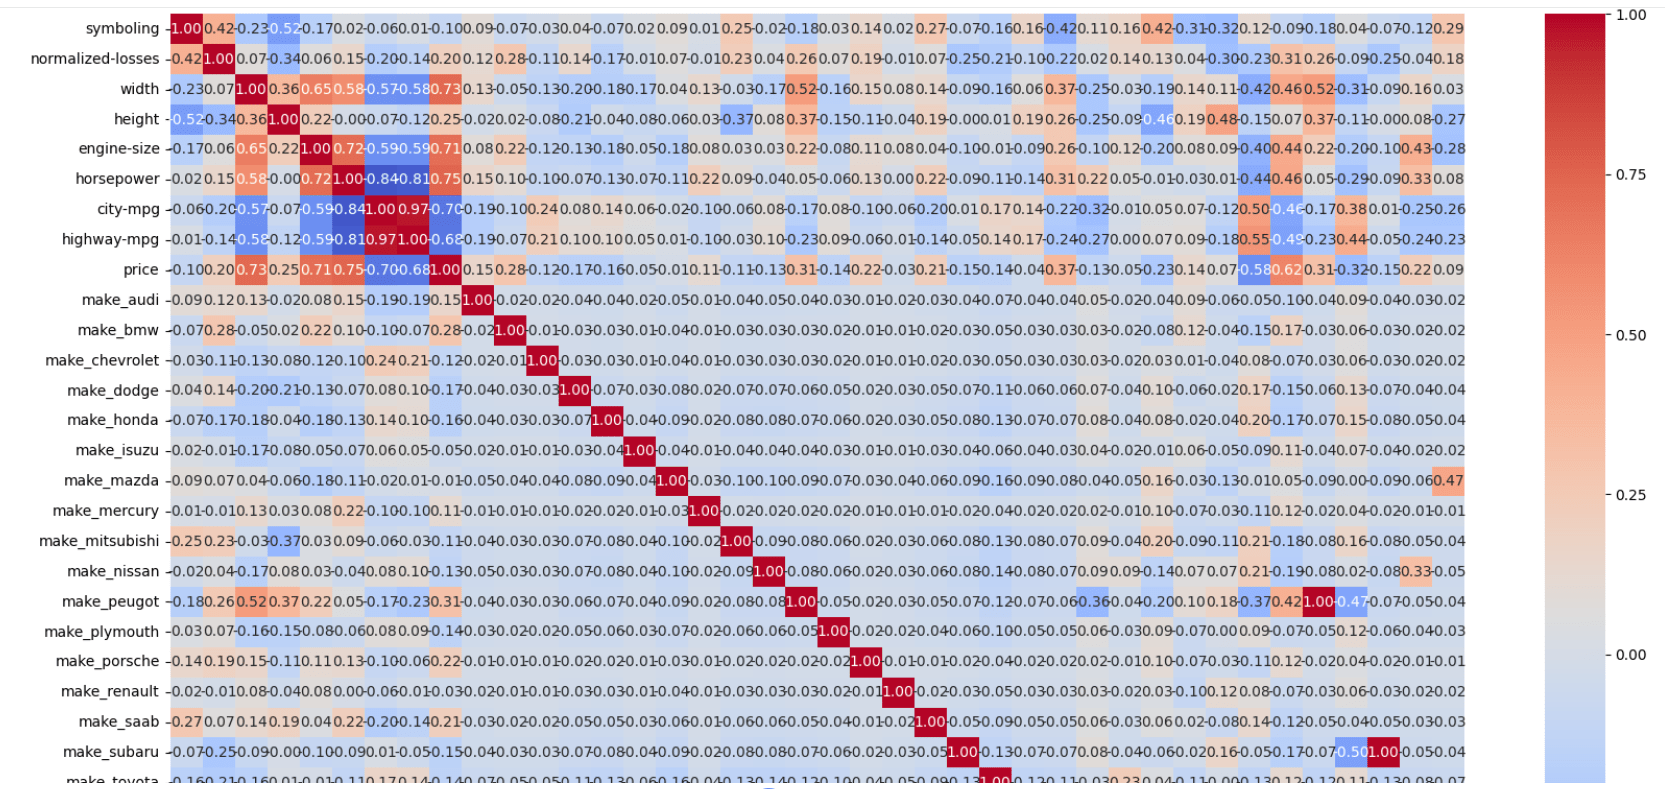
Activity
Prepare a Feature Relationship Report.
| Feature | Correlation with Price | Strong / Moderate / Weak |
|---|---|---|
| engine-size | ||
| horsepower | ||
| curb-weight | ||
| city-mpg | ||
| highway-mpg |
Task 2: Visualize Business Insights
After identifying feature relationships, your manager wants visual evidence that can be presented to stakeholders.
Data visualizations help business teams understand trends more effectively than raw numbers.
Create visualizations to investigate how different vehicle characteristics influence price.
Generate the Visualization for Engine Size vs Price
1
plt.scatter(df['engine-size'], df['price'])
plt.xlabel("Engine Size")
plt.ylabel("Price")
plt.show()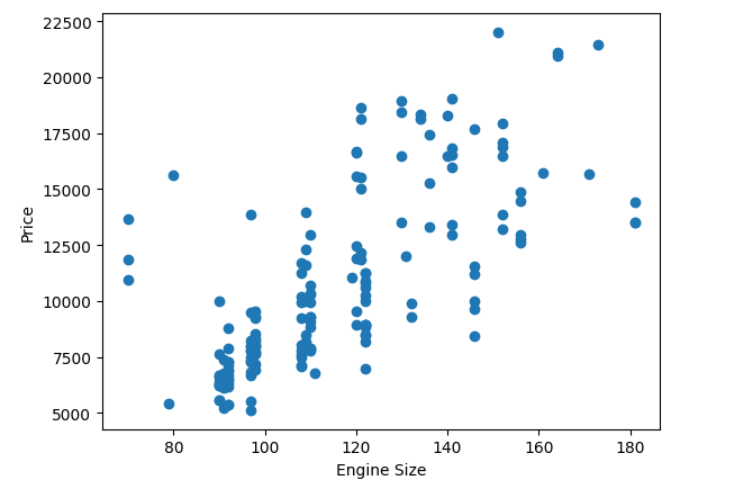
Generate the Visualization for Horsepower vs Price
2
plt.scatter(df['horsepower'], df['price'])
plt.xlabel("Horsepower")
plt.ylabel("Price")
plt.show()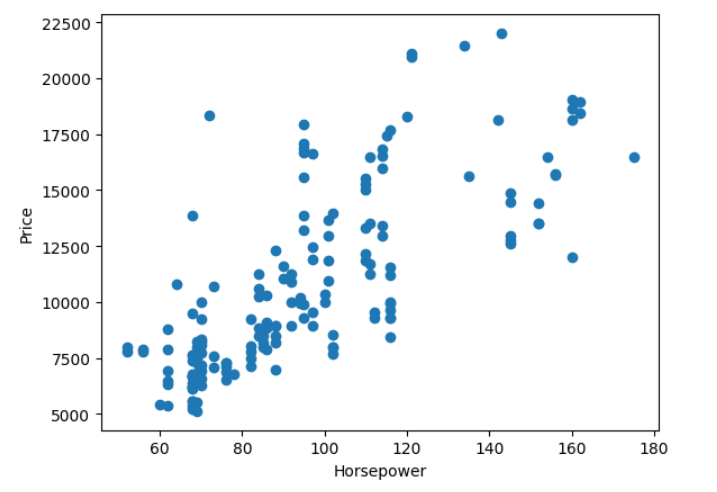
Generate the Visualization for Fuel Type vs Price
3
sns.boxplot(x='fuel-type', y='price', data=df)Activity
Create a Business Insight Report.
| Visualization | Observation |
|---|---|
| Engine Size vs Price | |
| Horsepower vs Price | |
| Fuel Type vs Price |
Task 3: Scale Features for Model Training
The Data Science team has informed you that some Machine Learning algorithms perform better when features are on similar scales.
For example:
| Feature | Value Range |
|---|---|
| engine-size | 60 - 326 |
| horsepower | 48 - 288 |
| city-mpg | 13 - 49 |
Large differences in scale can affect model performance.
Min-Max Scaling
Transforms values between 0 and 1.
Standardization
Transforms values to have:
- Mean = 0
- Standard Deviation = 1
Useful when data contains outliers.
Apply Min-Max Scaling
1
from sklearn.preprocessing import MinMaxScaler
scaler = MinMaxScaler()
scaled_features = scaler.fit_transform( df[['engine-size','horsepower','city-mpg']] )
Apply Standardization
2
from sklearn.preprocessing import StandardScaler
scaler = StandardScaler()
scaled_features = scaler.fit_transform( df[['engine-size','horsepower','city-mpg']] )
Task 4: Create New Features
The management team believes that individual features may not tell the complete story.
As a Data Scientist, you can create new features that may improve model performance.
This process is called Feature Engineering.
Feature Engineering
Feature Engineering is the process of creating new variables using existing data.
Well-engineered features often improve Machine Learning model accuracy.
Create New Features
1
Example 1:
df['power_to_engine_ratio'] = ( df['horsepower'] / df['engine-size'] )df['mileage_difference'] = ( df['highway-mpg'] - df['city-mpg'] )Example 2:
Task 5: Select the Best Features
The Data Science team is now preparing the final dataset for model development.
However, not every feature contributes equally to predicting vehicle prices. Some features may have little or no relationship with the target variable.
Your manager wants you to identify the most relevant features before model training begins.
As a Junior Data Scientist, your responsibility is to select features that provide useful information while removing less relevant variables.
Feature Selection
Feature Selection is the process of identifying the most useful features for a Machine Learning model.
Benefits:
- Improves model performance
- Reduces training time
- Removes irrelevant information
- Makes models easier to interpret
Calculate Correlation with Price
1
df.corr(numeric_only=True)['price'].sort_values(ascending=False)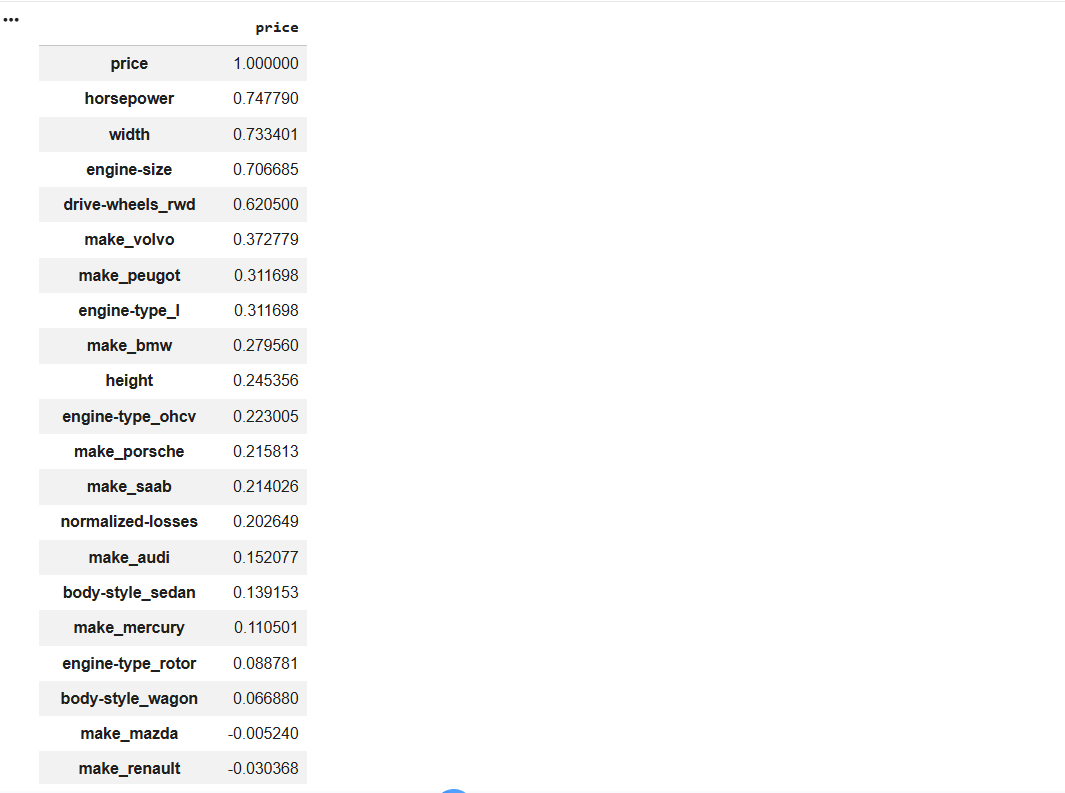
Visualize Feature Relationships Using a Heatmap
2
corr_matrix = df.corr(numeric_only=True)

# Plot Heatmap
plt.figure(figsize=(18,12))

sns.heatmap(
    corr_matrix,
    annot=True,
    fmt='.2f',
    cmap='RdYlBu_r',
    linewidths=0.5,
    annot_kws={'size':8}
)

plt.title('Correlation Heatmap', fontsize=16)
plt.xticks(rotation=45, ha='right')
plt.yticks(rotation=0)

plt.tight_layout()
plt.show()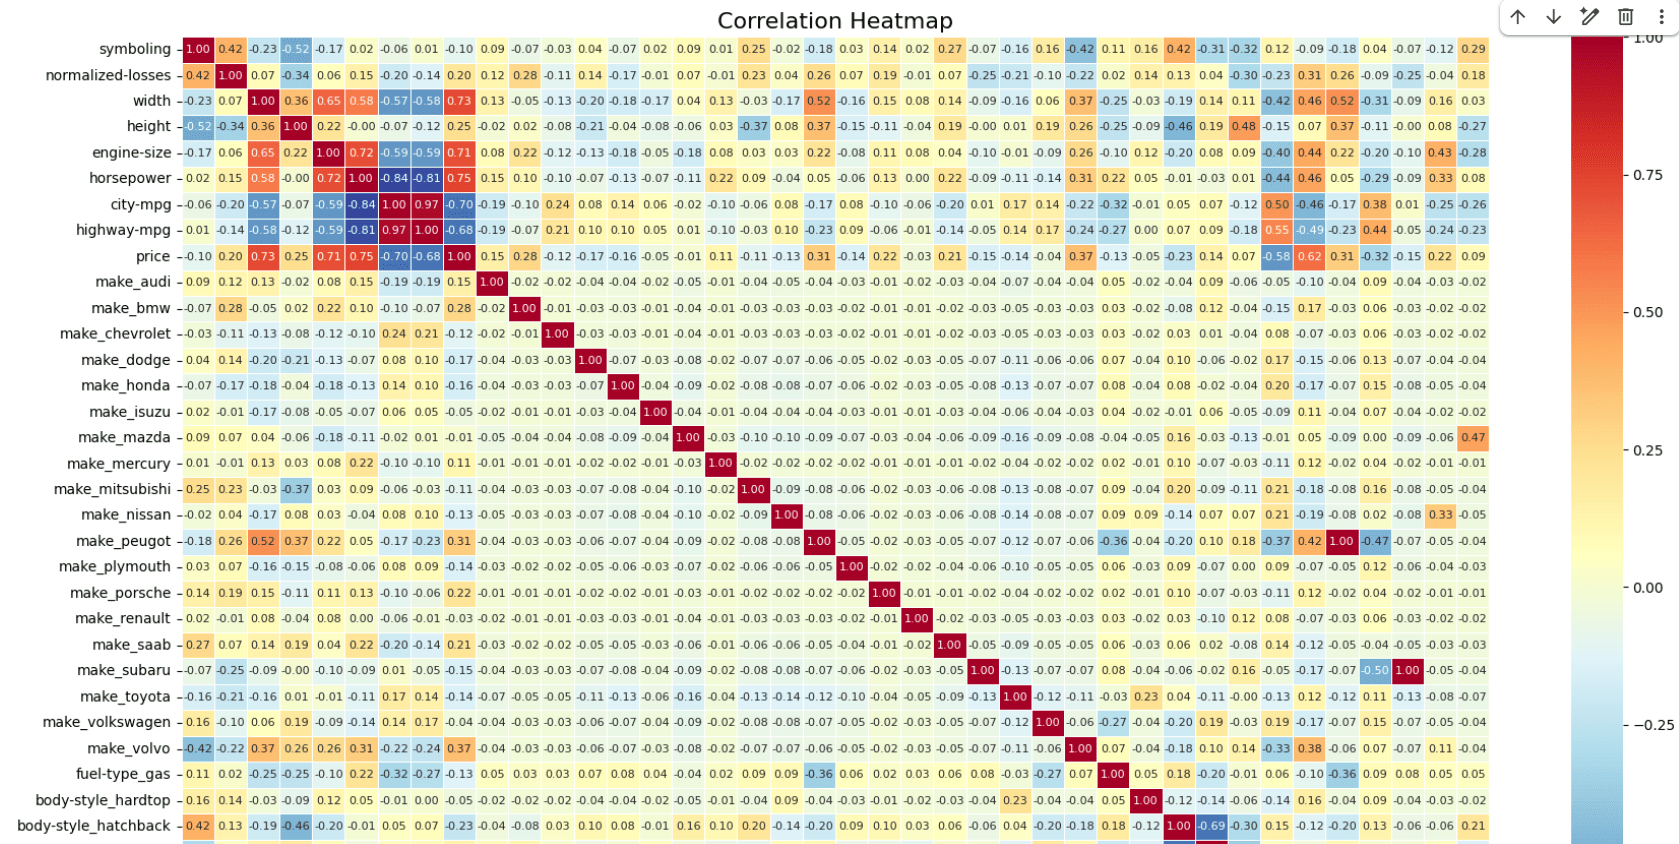
Select Important Features
3
Identify the features that have strong or moderate relationships with vehicle price.
As a guideline:
| Correlation Value | Decision |
|---|---|
| Greater than 0.70 | Strong Feature |
| 0.30 – 0.70 | Moderate Feature |
| Less than 0.30 | Weak Feature |
Create Selected Feature List
4
selected_features = [
    'engine-size',
    'horsepower',
    'curb-weight',
    'width',
    'wheel-base'
]

X = df[selected_features]
y = df['price']
Task 1: Understanding BRD
Before you start building anything, you need to clearly understand what the client actually wants.So, let’s begin by understanding the BRD (Business Requirement Document) shared by the client.
BRD Full Form is Business Requirement Details.BRD like a plan for building a house. This plan helps the builder understand what to build.In the same way,BRD tells developers what the client wants to build
Click to download BRD : BiteBox_BRD.pdf
Activity
After going through BRD list down the Core Features and Web Pages in the tabulated Format as shown Below.
| Col 1 | Col 2 | Col 3 |
|---|---|---|
| Row 1 | ||
| Row 2 | ||
| Row 3 |
Formula
Profit = Revenue - Cost
Task 2: Create WireFrame
Now that you understand the requirements, don’t jump into coding yet. Before development, we always visualize the layout.
Now lets create a simple wireframe for the homepage.
A wireframe is like a layout plan of a house. Before building, you decide where rooms, doors, and windows will be placed.Similarly, a wireframe helps you plan where elements like headers, images, and buttons will appear on a webpage—before adding design or colours.
Task 3: Code Editor Installation
Good work on completing the planning phase.
Now we will start development. Before that, make sure your system is ready with the required tools.
In this step we will install the VS code editor that will help to Write code efficiently,Organize files , Run and test your application
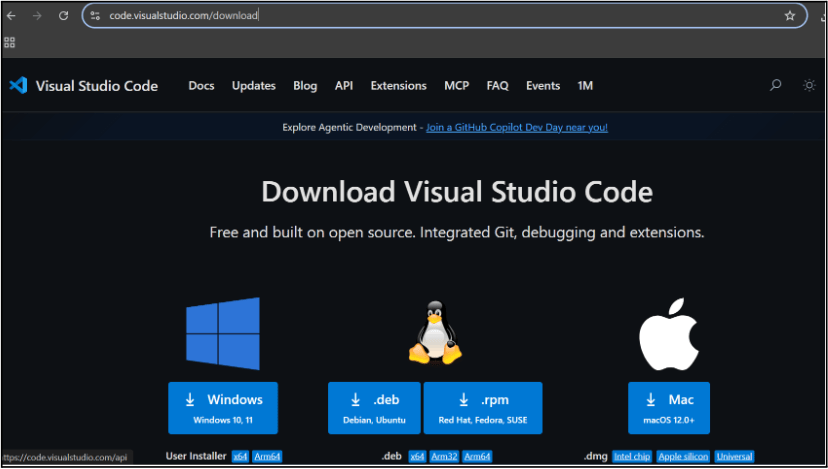
Go to the visual studio code official website
1
Click to download Homepage Wireframe : Homepage Wireframe
Choose your operating system(windows / Mac) and download the installation file.
Double click on the download app and Accept the agreement and click next
2
It is a long established fact that a reader will be distracted
b
Sub Steps
a
Double click on the download app and Accept the agreement and click next
public class MathSample {
    public static void main(String[] args) {
        int x = 10;
        int y = 20;
        int sum = x + y;

        System.out.println("The sum is: " + sum);
    }
}
public class MathSample {
public static void main(String[] args) {
int x = 10;
int y = 20;
int sum = x + y;
System.out.println("The sum is: " + sum);
}
}
public class MathSample {
public static void main(String[] args) {
int x = 10;
int y = 20;
int sum = x + y;
System.out.println("The sum is: " + sum);
}
}
Great job!
You have successfully completed your first lab on BiteBox Project Onboarding.
In this lab, you have: Understood the BRD, Created a wireframe, Set up your development environment, Organised your project structure, Run your first program
You are now ready to move to the next stage of development
Checkpoint
Next-Lab Preparation
Git Push
git push origin branchNameTopic : Working with a Text and Listin HTML
1) Power of HTML text tags
2) Customizing your style with CSS
3) Listing it right using HTML
4) HTML Link up , attributes of tag, block vs inline elements
Text box Width : 887
Business Scenario, Pre-lab Preparation, Next-lab Preparation, Task, Activity, Checkpoint : 90%.
Steps : 1,2,3 [Sub Steps - a,b,c]
Normal Text, Topic Name : 80%
Subtopic : 70%
Code Box font Size : 16px