Identifying Latent Intentions
via
Inverse Reinforcement Learning
in
Repeated Public Good Games
Carina I Hausladen, Marcel H Schubert, Christoph Engel

MAX PLANCK INSTITUTE
FOR RESEARCH ON COLLECTIVE GOODS
- Social Dilemma Games
-
Initial contributions start positive but gradually decline over time.
-
-
Classify behavior to understand contribution patterns
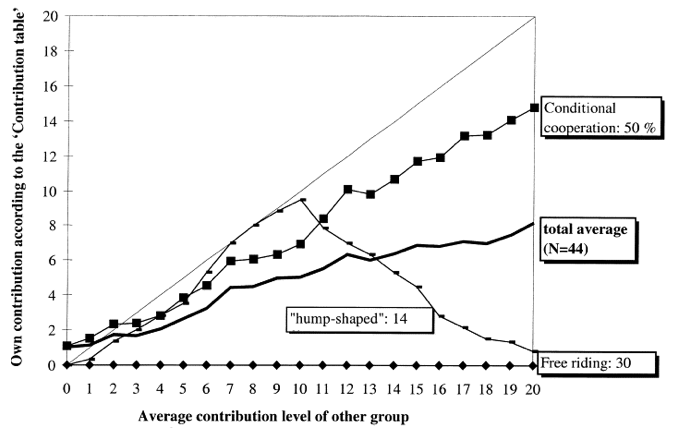
- Fischbacher et al. (2001) via Selten (1967)'s Strategy Method
Meta-Analysis
Thöni et al. (2018)
61.3%
19.2%
10.4%
Meta-Analysis
Thöni et al. (2018)
Conditional Cooperation
19.2 %
Hump-Shaped
Fischbacher et al. (2001)
61.3 %
Freeriding
10.4 %
Meta-Analysis
Thöni et al. (2018)
Conditional Cooperation
19.2 %
Hump-Shaped
Fischbacher et al. (2001)
61.3 %
Freeriding
10.4 %
Strategy Method Data
Game Play Data
Analysing Game Play Data
- Finite Mixture Model Bardsley 2006
- Bayesian Model
Houser 2004
-
C-Lasso
Bordt 2019
- Clustering
Bolle 2021
Theory Driven
Data Driven
Analysing Game Play Data
Theory Driven
Data Driven
- Finite Mixture Model
- Bayesian Model
-
C-Lasso
-
Clustering
Bardsely (2006)
Houser (2004)
Fallucchi (2021)
Fallucchi (2019)
Analysing Game Play Data
- Finite Mixture Model
- Bayesian Model
-
C-Lasso
-
Clustering
Theory Driven
Data Driven
- Assumes Four Types
- Estimates type probabilities and behavioral parameters via EM.
- Functional form: Decision depends on past choices, payoffs, and group behavior.
- Classifies individuals and estimates parameters simultaneously.
- Penalizes differences to reveal latent behavioral groups.
- Functional Form: Based on past choices, payoffs, and future value.
- Estimation: Bayesian mixture model
- Clustering: Gibbs sampling assigns behavioral types.
- Pattern recognition: Own & co-player decisions
- Manhattan Distance + Hierarchical clustering
Analysing Game Play Data
- Finite Mixture Model
- Bayesian Model
-
C-Lasso
-
Clustering
Theory Driven
Data Driven
Theory first: Use theory to find groups
Model first:
Specify a model, then find groups
Data first: Let the data decide groups, then theorize
Behavior Beyond Theory
- Finite Mixture Model
- Bayesian Model
-
C-Lasso
-
Clustering
Theory Driven
Data Driven
Bardsely (2006)| Tremble terms: 18.5%.
Houser (2004) | Confused: 24%
Fallucchi (2021) |Others: 22% – 32%
Fallucchi (2019) |Various: 16.5%
initial tremble
simulated
actual
Others
18.5%
24%
32%
16.5%
random / unexplained
Step 1
Clustering
→ uncover patterns
Step 2
Inverse Reinforcement Learning
→ interpret patterns
Can we build a model that explains both
the behavior types we know and the ones we don’t?
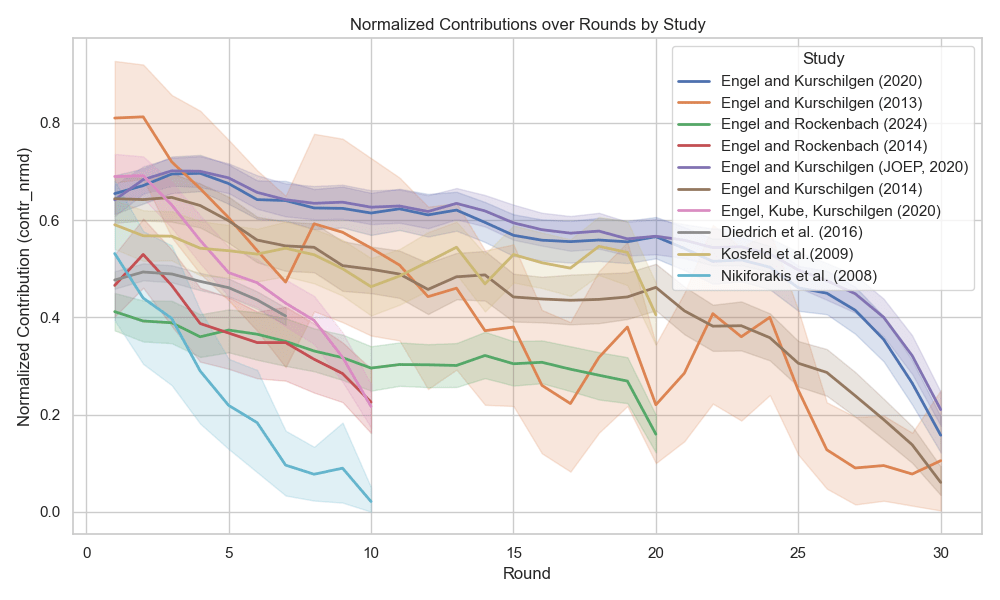
Dataset
- Data from 10 published studies
-
2,938 participants,
50,390 observations - Game play data
- Standard linear public good games
- No behavioral interventions
- Identical information treatment
two-dimensional time series
per player
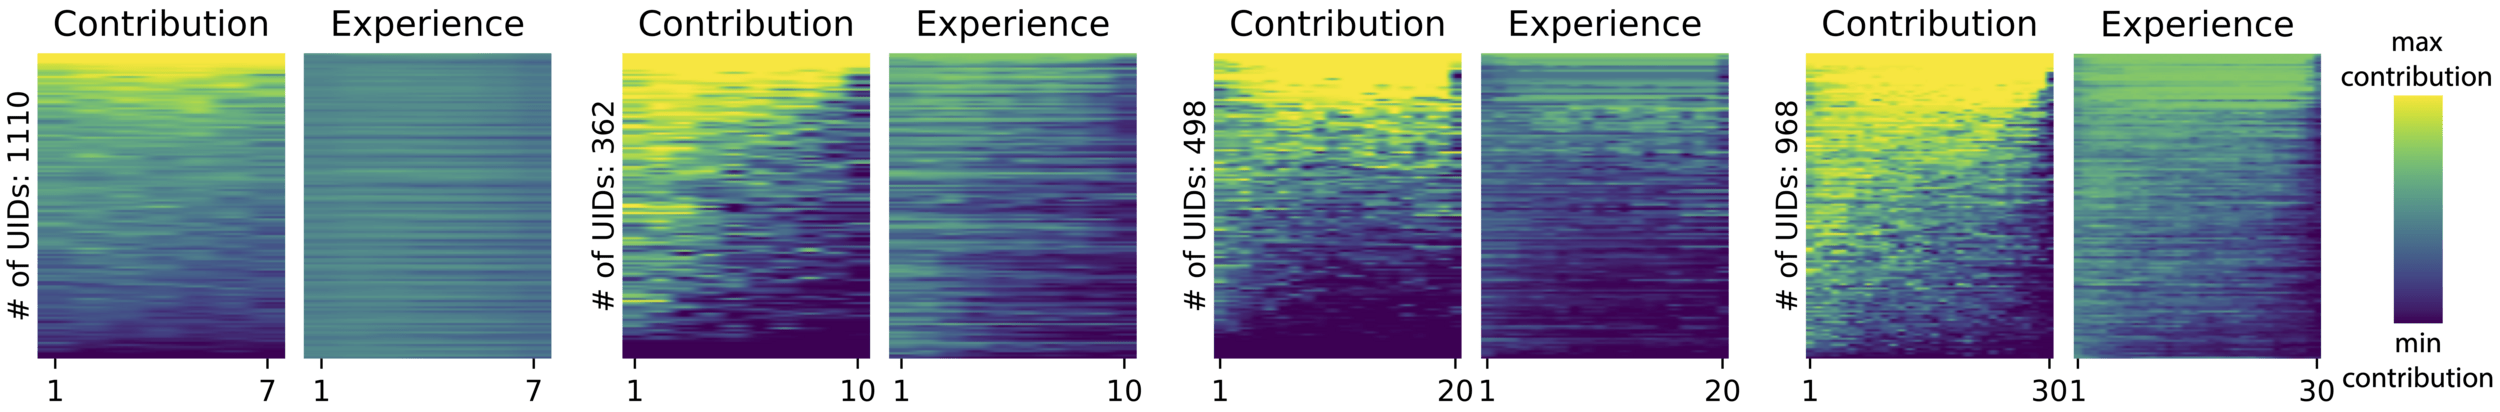
rounds
highest mean contribution
lowest mean contribution
Dataset
What are the most common patterns in the data?
What are the most common patterns in the data?
Step 1
Clustering
→ uncover patterns
Step 2
Inverse Reinforcement Learning
→ interpret patterns
Analysing Game Play Data
Data Driven
- Dimensionality reduction
-
Our approach:
-
Unsupervised modeling to uncover structure
-
Then apply theory to interpret the clusters.
-
-
Bottom line:
Clustering is not a substitute for theory — it is a way to structure behavioral complexity before theorizing.
Clustering consists of three main steps
- Choose the number of clusters k
- Calculate distances between series
- Apply a clustering algorithm to group similar series
Calculating Distances
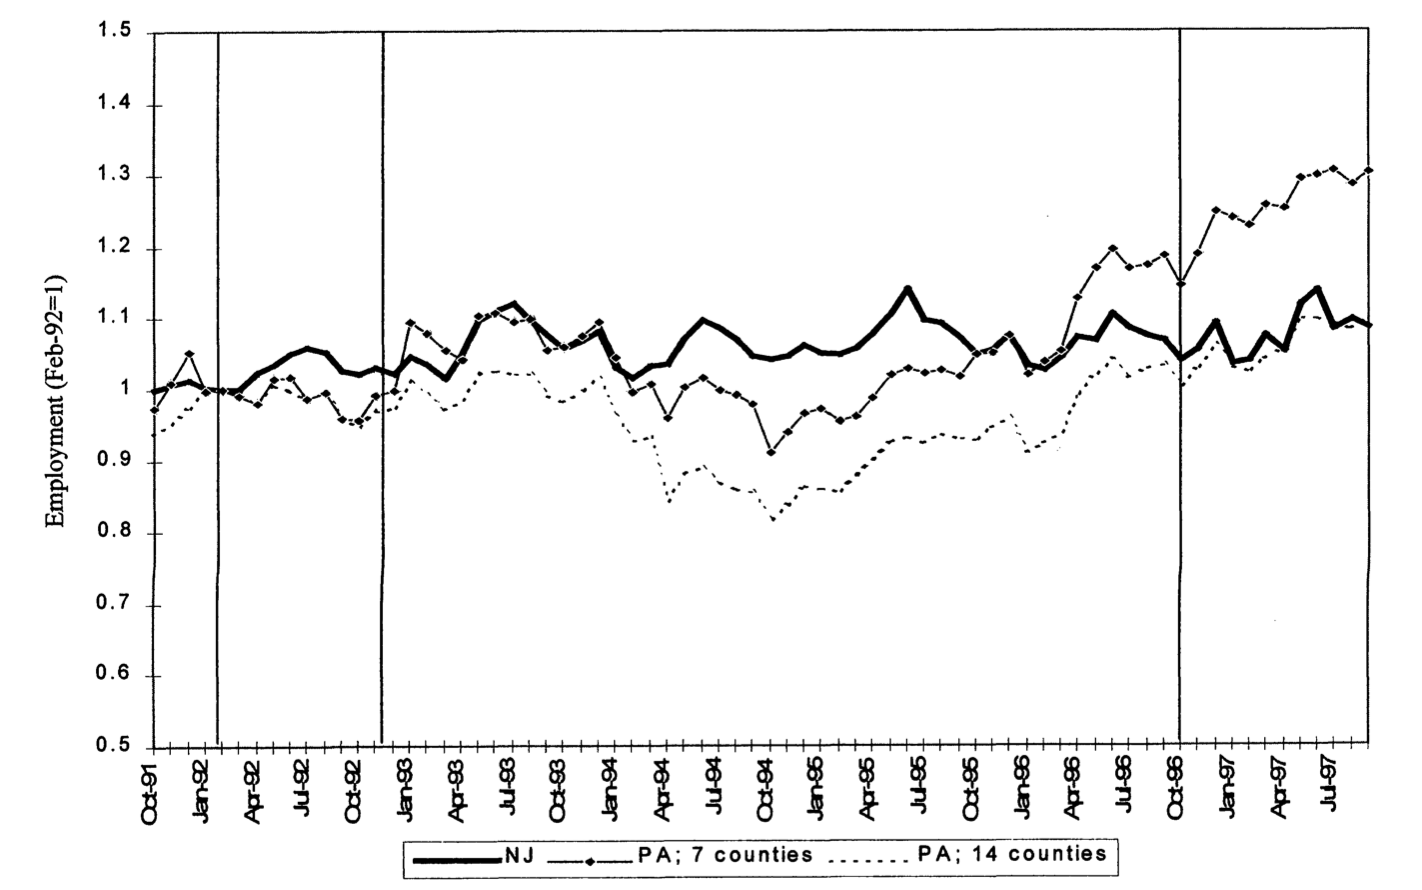
- Minimum wage increase in NJ (April 1992) hit all firms at the same calendar time.
- The policy hit all fastfood companies in NJ at the same time.
Minimum Wages and Employment
Cart & Krueger (2000)
- Round 2 ≠ same experience
- Local time-points are misleading
- Better: compare global shape
Local Distance Metric
rounds
20
contribution
1
0
Local Distance Metric
-
Finds the best match between similar patterns
-
Does not force strict x-alignment.
Dynamic Time Warping (DTW)
Local Similarity Measure
Global Similarity Measure
Dynamic Time Warping (DTW)
Euclidean Distance
Local Similarity Measure
Global Similarity Measure
-
Results depend fundamentally on how similarity is defined
-
The way we measure differences between time series is not neutral — it encodes our theoretical assumptions about what counts as meaningful variation.
Empirical Perspective
Clustering consists of three main steps
- Choose the number of clusters k
- Calculate distances between series
- Euclidean (local)
- DTW (global)
- Apply a clustering algorithm to group similar series
- k-means clustering
- Gaussian Mixture Models (GMM)
- Agglomerative clustering
Agglom
GMM
k-means
Agglom
GMM
k-means
DTW
Euclidean
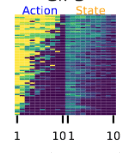
k-means
uids
round
global
local
Agglom
GMM
k-means
DTW
Euclidean
k-means
highest
mean contribution
lowest
mean contribution
DTW
Euclidean
Contrasting Perspectives
- A local— drop from high to low contributions at different times,
- within a global trend of sustained high then low contributions.
- A shared local switching point,
but clusters stay noisy due to ignored global patterns.
DTW
Euclidean
-
Results depend fundamentally on how similarity is defined.
-
We focus on generalizable patterns that hold despite idiosyncratic group differences and varying game lengths.
-
→ Not “people switch in round 5”
-
→ But: a tipping point emerges after which contributions remain low.
DTW
Euclidean
-
Results depend fundamentally on how similarity is defined.
-
We focus on generalizable patterns that hold despite idiosyncratic group differences and varying game lengths.
-
→ Not “people switch in round 5”
-
→ But: a tipping point emerges after which contributions remain low.
Our
Clustering Setup
Clustering consists of three main steps
- Choose the number of clusters k
- Calculate distances between series
- Apply a clustering algorithm to group similar series
Clustering consists of three main steps
- Choose the number of clusters k
- Calculate distances between series
- Apply a clustering algorithm to group similar series
- form of model fit for unsupervised learning
- internal criteria for whether the clustering makes sense
Clustering consists of three main steps
- Choose the number of clusters k
- Calculate distances between series
- Apply a clustering algorithm to group similar series
Clustering consists of three main steps
- Choose the number of clusters k
- Calculate distances between series
- DTW distance (global)
- Apply a clustering algorithm to group similar series
Clustering consists of three main steps
- Choose the number of clusters k
- Calculate distances between series
- Apply a clustering algorithm to group similar series
- Spectral Clustering
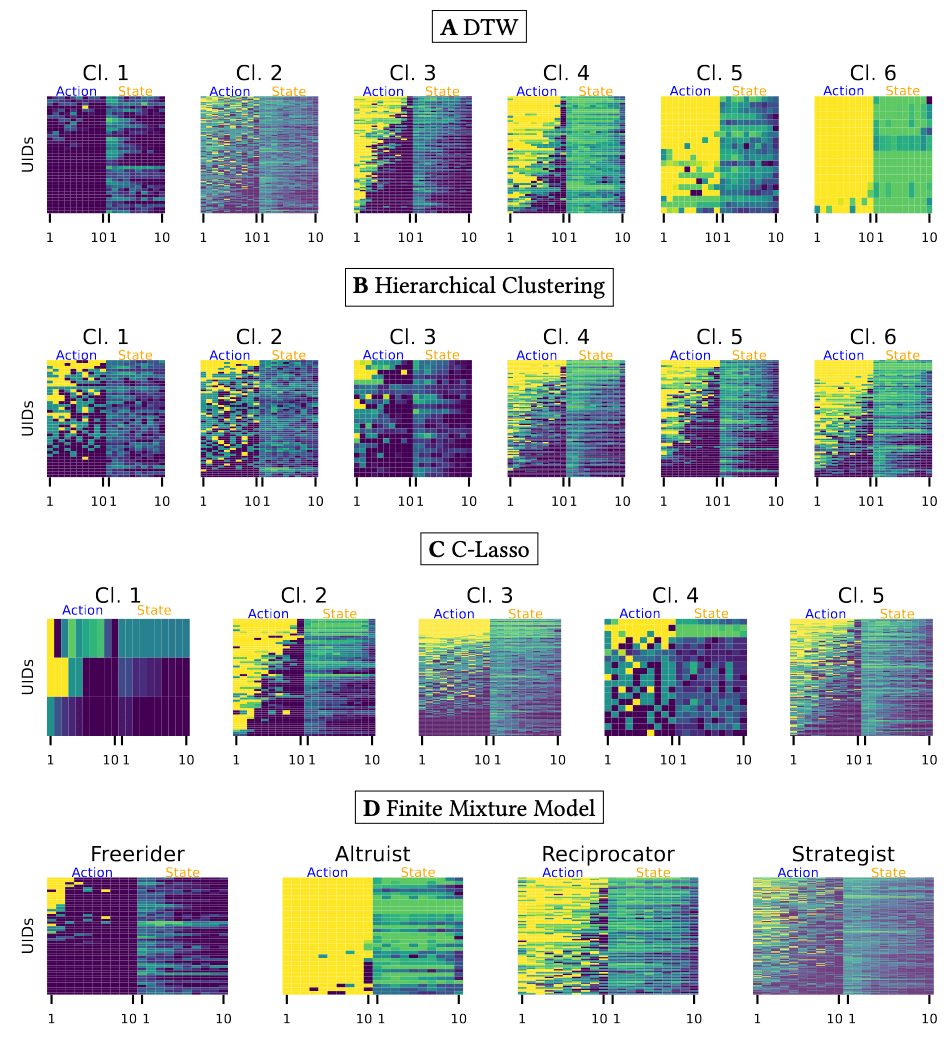
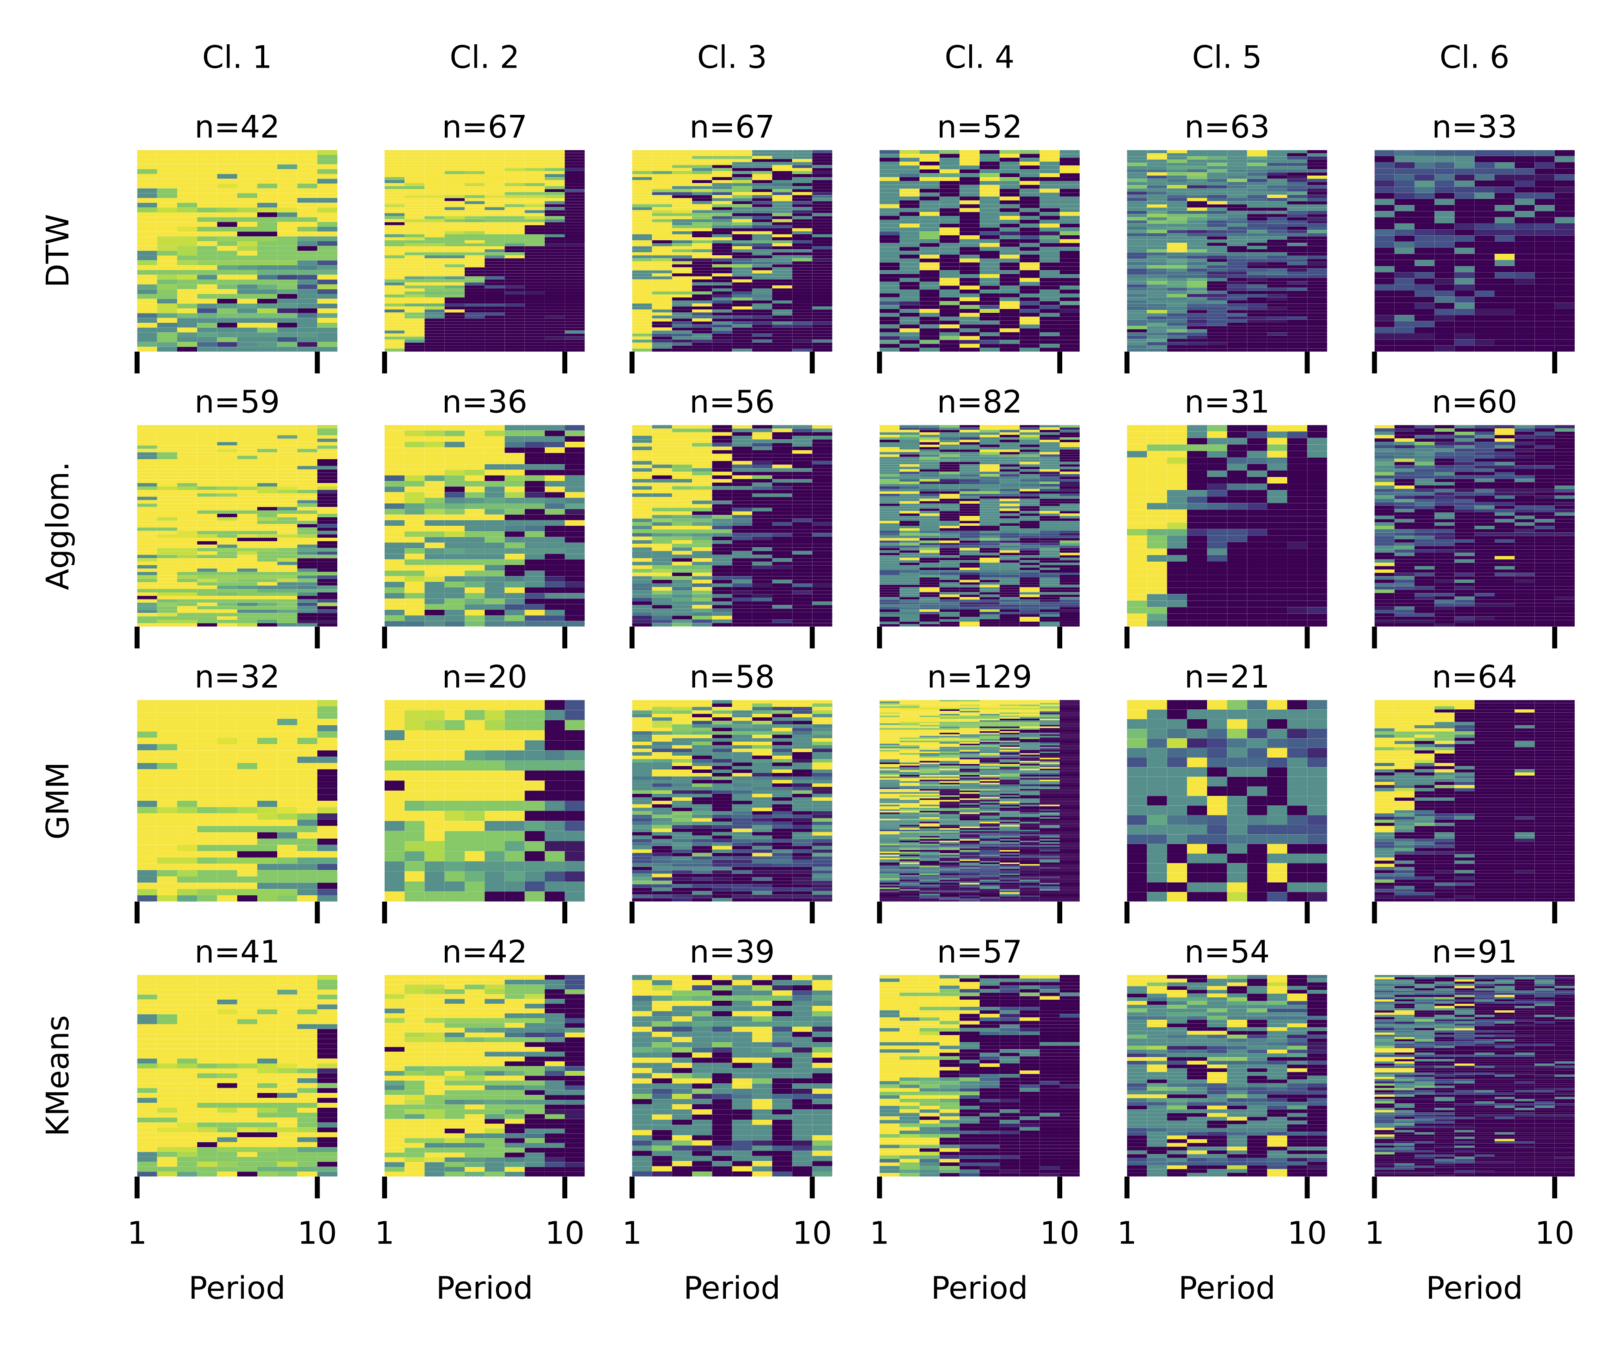
Comparing Partitioning Methods
Theory Driven
Data Driven
Manhattan +
Finite Mixture Model
Bayesian Model
C-Lasso
DTW +
Spectral Clustering
Hierarchical Clustering
Theory Driven
Data Driven
Finite Mixture Model
C-Lasso
DTW Distance
Manhattan Distance
Finite Mixture Model
C-Lasso
DTW
Local
Clustering
DTW-based clustering leads to a clearer, less noisy partition.
Interpreting the Clusters
Interpreting the Clusters
Step 1
Clustering
→ uncover patterns
Step 2
Inverse Reinforcement Learning
→ interpret patterns
- Most literature relies on ad-hoc interpretation of heat in own vs. others' contribution plots.
- However, we have seen that local alignment has shortcomings.
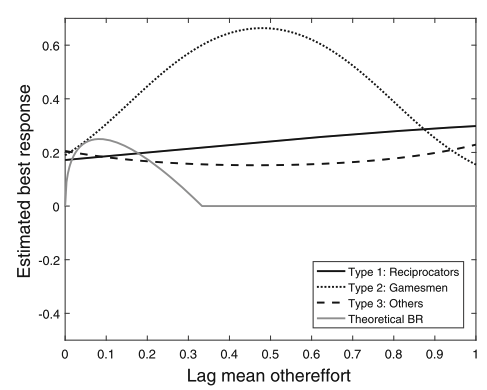
- evolutionary game-theoretic learning
- best-response learning
-
reinforcement learning
-
Q-learning was recently applied to the
- prisoner's dilemma (Dolgopolov 2024) and
- PGGs (Zheng 2024).
-
Q-learning was recently applied to the
Learning in social dilemmas
The key challenge is to define a reward function.
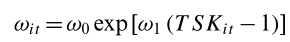
Reward Function
Inverse RL recovers reward functions from data.
- Lead to breakthroughs in robotics, autonomous driving, and modeling animal behavior.
- Past models used smoothly time-varying reward functions
(Alyahyay 2023). - New approaches model behavior with discrete reward functions
- Hierarchical Inverse Q-Learning (HIQL) (Zhu 2024)
Hierarchical Inverse Q-Learning
18.5%
24%
32%
16.5%
random / unexplained
Hierarchical Inverse Q-Learning
action
state
- Markov Decision Process: \( P(s' |s,a) \)
- Behavior of a Q-learner:
- maintains a Q-table
- exploitation vs. exploration
- Q-value update
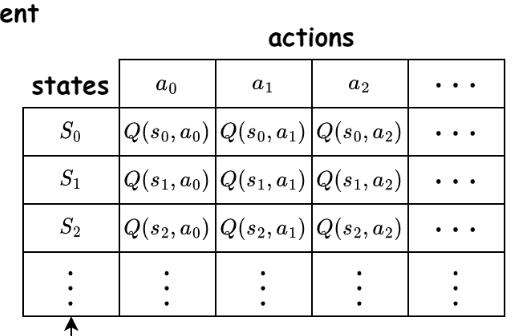
\( Q(s,a) = (1- \alpha) Q(s,a) + \alpha \left( r + \gamma \max Q(s', a') - Q(s,a) \right) \)
Expected best possible outcome from the next state
Compare to now
re-ward
Hierarchical Inverse Q-Learning
action
state
- Agents learn
- a value function (Q) that maps state-action pairs to expected future rewards
-
to act optimally over time without solving the full Bellman equation upfront
-
Very intuitive for modeling boundedly rational players in repeated games
\( Q(s,a) = (1- \alpha) Q(s,a) + \alpha \left( r + \gamma \max Q(s', a') - Q(s,a) \right) \)
Hierarchical Inverse Q-Learning
\( Q(s,a) = (1- \alpha) Q(s,a) + \alpha \left( r + \gamma \max Q(s', a') - Q(s,a) \right) \)
re-ward
action
state
Estimate the reward function by maximizing the likelihood of observed actions and states.
unknown
Hierarchical Inverse Q-Learning
action
state
Instead of learning Q-values from rewards, we observe actions and states and try to infer what reward function the agent must be optimizing.
Hierarchical Inverse Q-Learning
\( r_{t-1} \)
\( a_{t-1} \)
P
\( s \)
\( \Lambda \)
\( r_t \)
\( a_t \)
P
\( s_{t+1} \)
discrete transition
Hierarchical Inverse
Q-Learning
\( P(r_t \mid s_{0:t}, a_{0:t}) \)
action
state
\( r \)
\( r_{t-1} \)
\( \Lambda \)
\( r_t \)
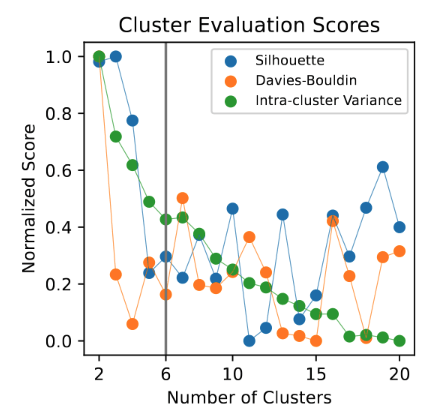
How many reward functions should we estimate?
How many reward functions should we estimate?
1
2
3
4
→ 2
→ 3
→ 4
→ 5
0.6
0.4
0.2
0.2
75.2
88.6
101.5
114.4
\( \Delta \) Test LL
\( \Delta \) BIC
Choice of two intentions aligns with the fundamental RL principle of exploration vs. exploitation.
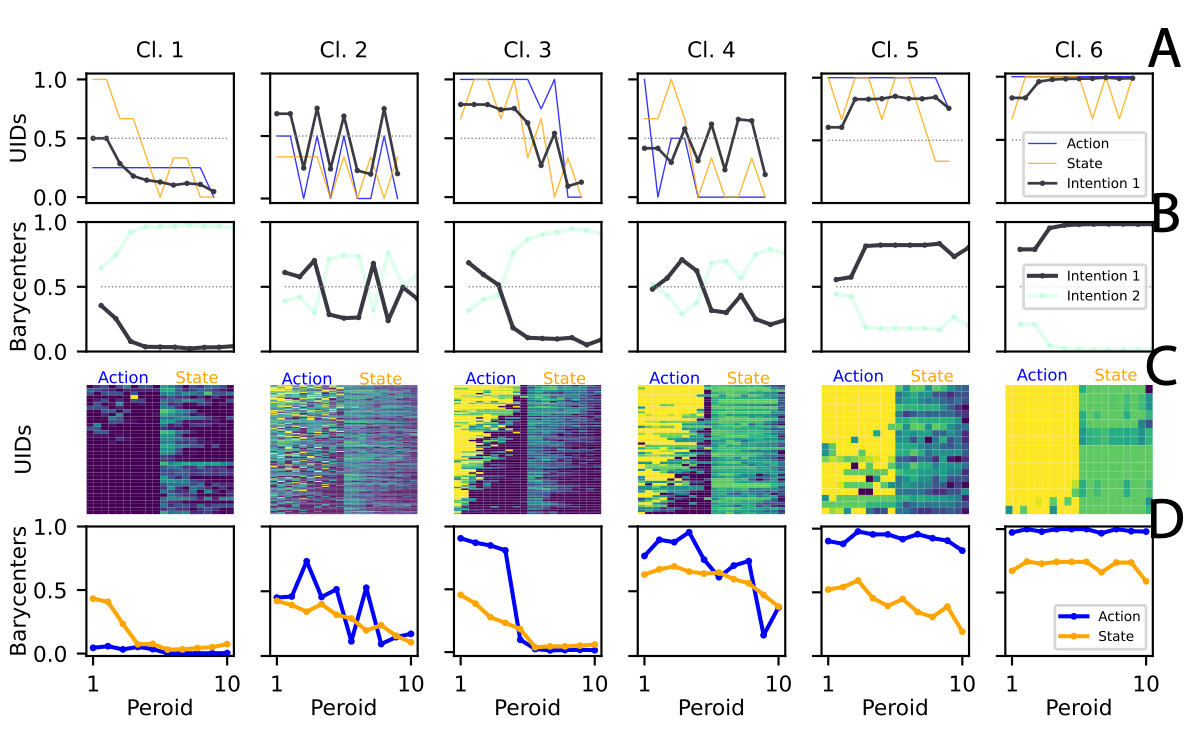
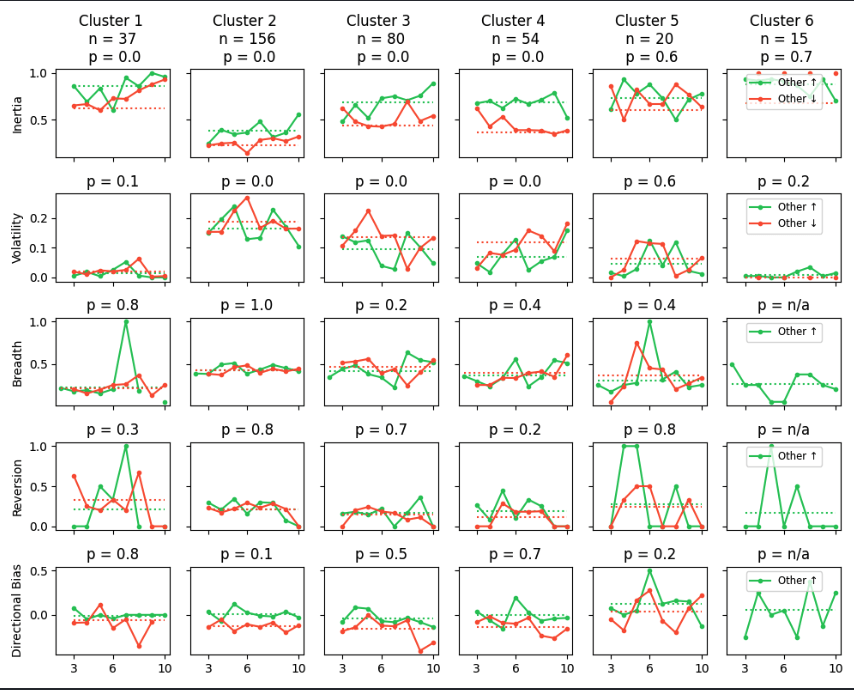
Unconditional
Cooperators
Consistent
Cooperators
Threshold
Switchers
-
- The intention to free-ride is not fixed.
- Some variation exists, but the competing intention never exceeds the adoption threshold .
Freeriders
Volatile
Explorers
- The cluster actively experiments with new strategies.
- Deliberate switching between strategies.
- The intention to free-ride may be less rigid than previously assumed.
- Longer horizons
- increase intention volatility and thus
- create more opportunities for behavioral shifts.
Freeriders
- Longer time horizons generally promote cooperation.
- A small group of participants remains cooperative regardless of game duration.
- For some, cooperation is a stable trait rather than a response to game length.
Consistent Cooperators
Conclusion
- Dataset with ~ 50'000 observations from PGG
- Use a global distance metric to partition the data
- Threshold Switching
- Threshold Switching
-
Estimate latent intentions via HIQL
- Unifying theory to explain all behavioral clusters
(including the Other cluster) - Intention of consistent cooperation is independent of game length
- Intention to freeride is less stable over long time horizons
- Unifying theory to explain all behavioral clusters
carinah@ethz.ch
slides.com/carinah

S
Appendix
- Strategy method assumes one decision rule governs all decisions.
- Gameplay data requires a function that may change over time e.g. due to strategic and learning effects.
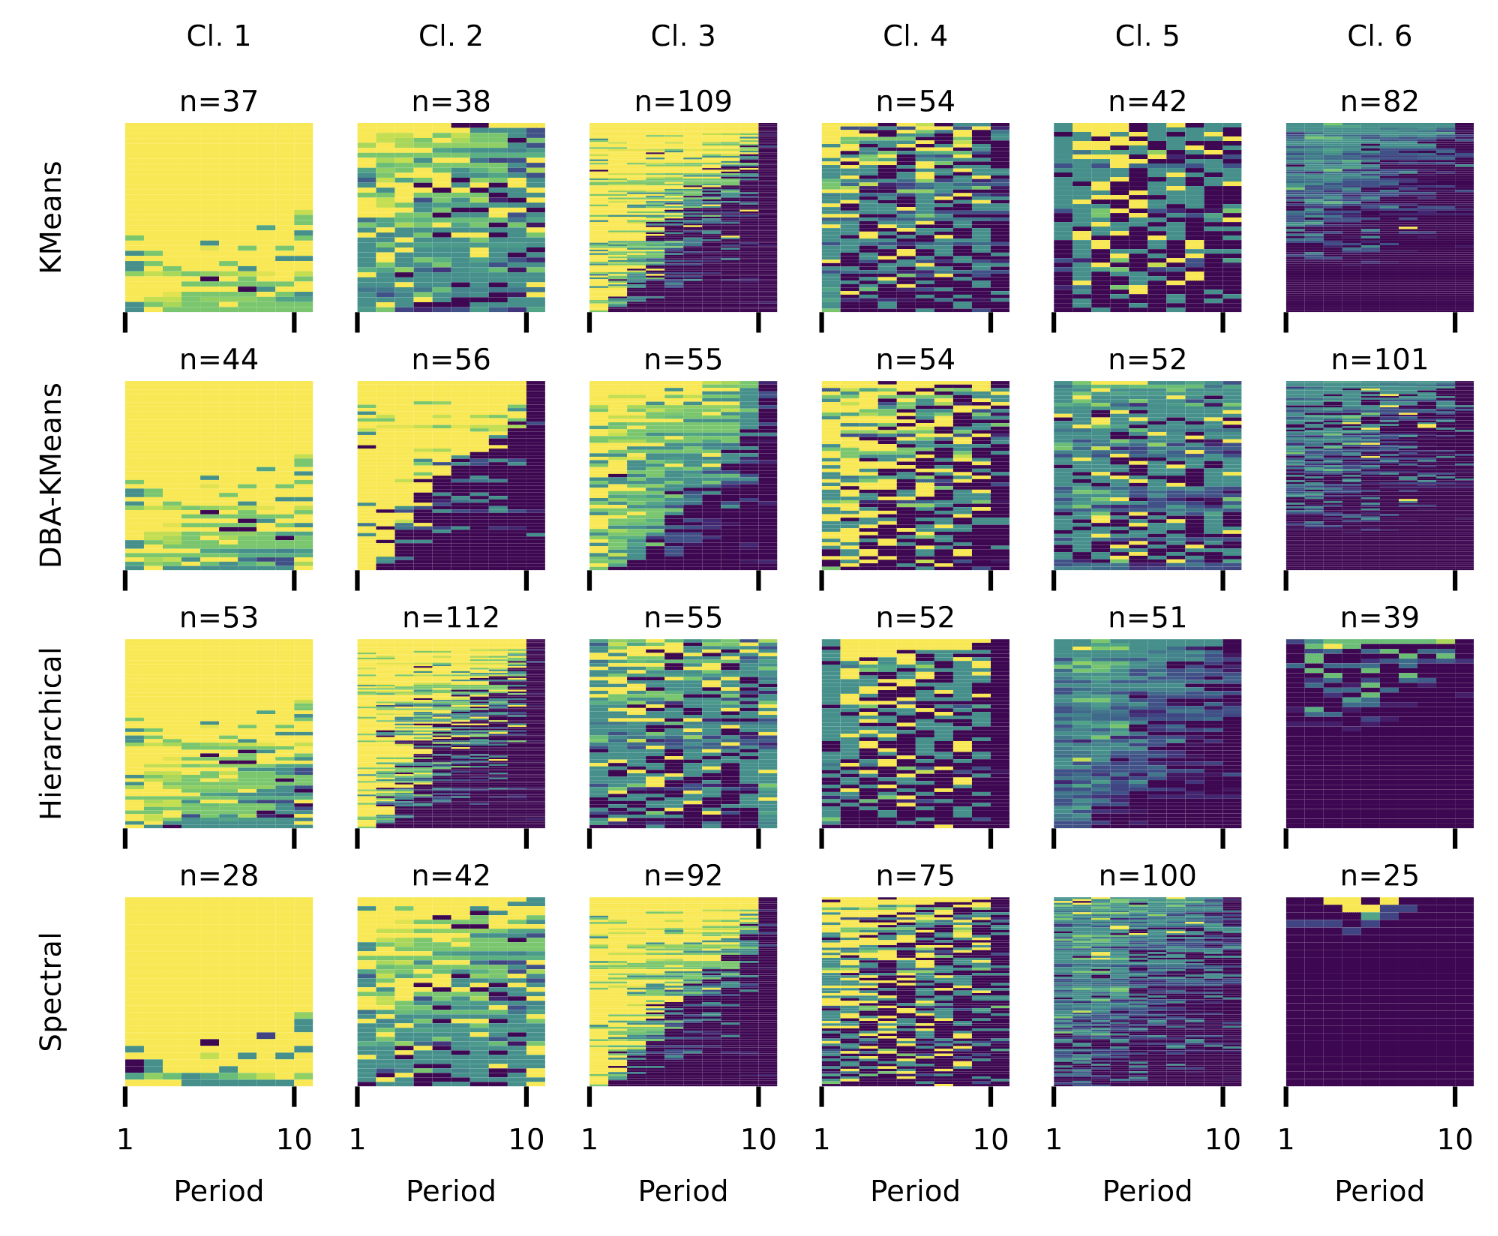
We find that partitioning the data using spectral clustering with DTW distance yields the cleanest and least noisy clusters.
- Intentions become less smooth with increasing game length.
- RL perspective: expected
- Longer time horizons = more opportunities to explore
RL Heuristics
-
Individuals display higher inertia when others ↑ as opposed to other↓
-
Adjustments exhibit greater variability following other↓ as opposed to others ↑
Agglom
GMM
k-means
DTW
Euclidean
k-means
highest
mean contribution
lowest
mean contribution
Data-Driven Approaches
Theory-driven classifications may not accurately capture the heterogeneity observed.
- Bayesian Model
(Houser 2004) -
C-Lasso / Penalized Regression
(Su 2016, Bordt 2019) - Clustering
(Bolle 2021)
Analysing Game Play Data
Theory-Based Approaches
Strategy-method types often align with actual gameplay data
(e.g. Muller 2008).
- Finite Mixture Model (Bardsley 2006)
- Bayesian Model (Houser 2004)
- Assume functional form: Decision dntdepends on past choices, payoffs, and future value function.
- Parameter estimation: Bayesian mixture model estimates how much each factor influences decisions.
- Parameter clsutering: Gibbs sampling assigns individuals to behavioral types based on posterior probabilities.
-
C-Lasso (Su 2016, Bordt 2019)
- Assume functional form: Decision depends on past choices, payoffs, and group behavior.
- Simultaneous classification and estimation.
- C-Lasso penalizes differences between individuals, clustering them into distinct decision-making types.
Analysing Game Play Data
Strong assumptions on decision-making :
- predefined functional form (e.g., polynomial)
- assumes which features matter
-
Clustering (Bolle 2021, Fallucchi (2018))
- does not assume a functional form.
- pattern recognition in the game data (own decision, decisions of group player
- hierarchical clustering with Manhattan Distance
Analysing Game Play Data
Detect behavioral patterns without assumptions.
Future Research Ideas

Use RL to derive a policy that maximizes agents' intrinsic motivation for sustainable behavior.
Simulate an economy to study emergent dynamics.
Existing simulations lack grounding in behavioral types (e.g., research on cooperation).
Incorporating behavioral types could improve simulations.
Tailored policies—potentially even type-specific—may lead to better outcomes.
- Intentions are inferred latent variables that combine observed actions and states using the Bellman equation.
- The Bellman equation assumption: Current actions are selected to maximize expected future discounted rewards.
- The intention itself is not directly observed but is instead estimated as a posterior probability based on the observed sequence of actions and states.
- These probabilities are computed in a way that maximizes the likelihood of observing the given actions and states, assuming the hierarchical structure.
Hierarchical Inverse Q-Learning
action
state
- Markov Decision Process: \( P(s' |s,a) \)
- Behavior of a Q-learner:
- maintains a Q-table
- exploitation vs. exploration
- Q-value update
\( Q(s,a) = (1- \alpha) Q(s,a) + \alpha \left( r + \gamma \max Q(s', a') - Q(s,a) \right) \)
Expected best possible outcome from the next state
Compare to now
re-ward
Analysing Game Play Data
- Finite Mixture Model
(Bardsley 2006) - Bayesian Model
(Houser 2004) -
C-Lasso
(Su 2016, Bordt 2019) - Clustering
(Bolle 2021)
- Functional form: Decision depends on past choices, payoffs, and group behavior.
- Classifies individuals and estimates parameters simultaneously.
- Penalizes differences to reveal latent behavioral groups.
Theory Driven
Data Driven
- Functional Form: Based on past choices, payoffs, and future value.
- Estimation: Bayesian mixture model infers factor influence.
- Clustering: Gibbs sampling assigns behavioral types.
- Assumes Four Types: Reciprocators, Strategists, Altruists, Free-Riders.
- Maximization via EM: Estimates type probabilities and behavioral parameters.
- No predefined model: Data-driven approach.
- Pattern recognition: Own & co-player decisions.
- Hierarchical clustering: Manhattan Distance.
Data-Driven Approaches
-
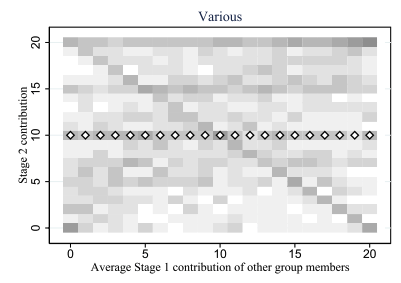
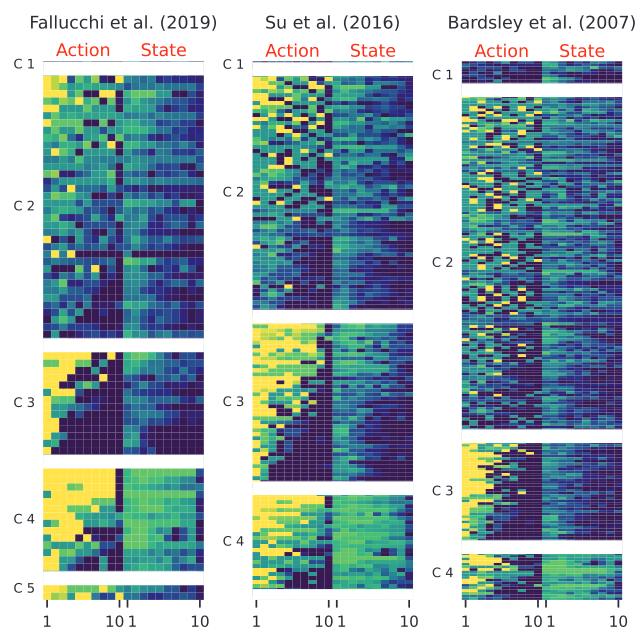
Fallucchi (2019):
"Various" group –
Unpredictable
contributions: 16.5% - Fallucchi (2021):
"Others" type –
Neither reciprocation nor strategy: 22% – 32%
Loosely / Un - explained Behavior
Theory-Based Approaches
-
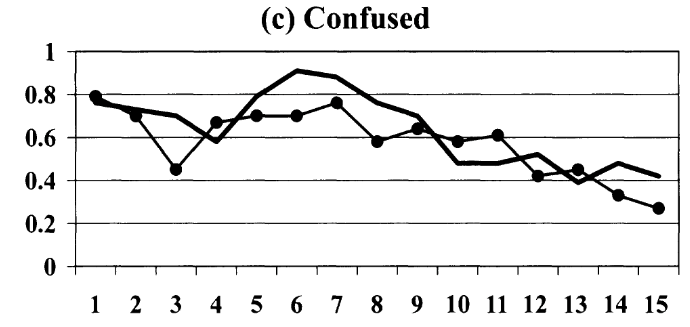
Houser (2004):
Confused –
High randomness and decision errors: 24% -
Bardsley (2006):
Tremble terms –
Random deviations (decline with experience): 18.5%.

Why do we find these "other" clusters?
And can we find a better descriptor than "confused"?
Theory-Based Approaches
-
Houser (2004):
Confused –
High randomness and decision errors: 24% -
Bardsley (2006):
Tremble terms –
Random deviations decline with experience: 18.5%.
Why do we find these "other" clusters?
And can we find a better descriptor than "confused"?
- Based on a theoretical model that initially was not built for game data.
- Ignores e.g. learning.
Data-Driven Approaches
-
Fallucchi (2019):
"Various" group –
Unpredictable
contributions: 16.5% - Fallucchi (2021):
"Others" type –
Neither reciprocation nor strategy: 22% – 32%
Why do we find these "other" clusters?
And can we find a better descriptor than "confused"?
- The partitioning is tailored to the data.
- The interpretation, however is not.
- It relies on the strategy-data type of thinking.
Action
State
- Markov Decision Process: \( P(s' |s,a) \)
- Goal: infer unknown reward function \(r (s, a) \)
- Behavioral policy of a Q-learner:
- Future rewards shape current decisions \( \gamma \).
- Humans implicitly learn and update \( Q(s,a) \) based on experience.
- \(Q(s,a) \;=\; r(s,a) \;+\; \gamma \sum_{s' \epsilon S} P(s'|s,a) \max_{a' \epsilon A} Q(s',a') \)
Strategy Table Data
Game Play Data
\( 21^{21} \approx 5.8 \times 10^{27} \)
\( (21 \times 21) ^{10 rounds} \)
On the Complexity of the Data
-
-
Explanations
-
Social preferences
-
Confusion
-

Unexplained behavior due to strict theoretical assumptions and limited techniques for interpretation.
Reliance on perfect point-wise alignment
Methods Analysing Game Play Data
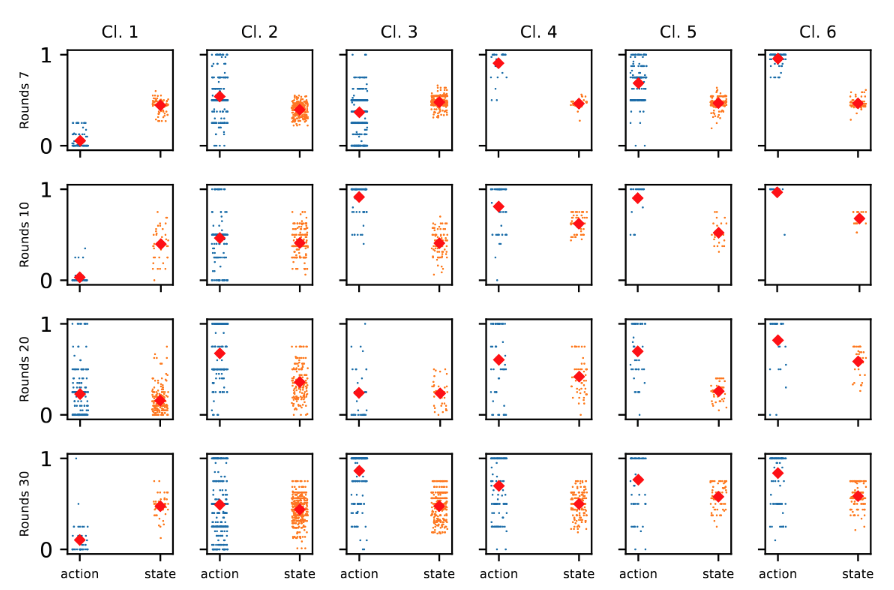
Two comparative observations
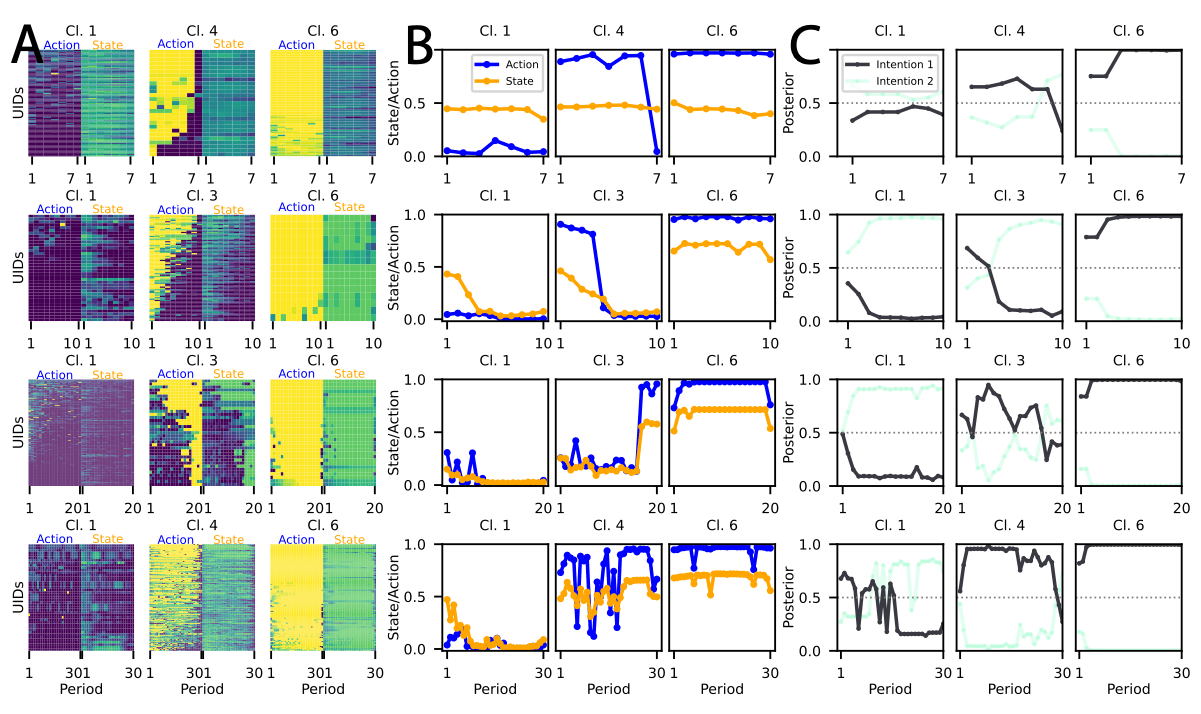
Intentions integrate actions and states.
- Traditionally, this behavior would have been dismissed as noise.
- This HIQL framework offers a unifying theoretical interpretation.
- Stable trends in other clusters indicate the dominance of one intention.
- Cluster 2 reflects frequent intention switching.
- Participants in Cluster 2 struggle between competing intentions.
Behavior Beyond Theory
- Finite Mixture Model
- Bayesian Model
-
C-Lasso
-
Clustering
Theory Driven
Data Driven
Bardsely (2006)| Tremble terms:
Random deviations that decline with experience: 18.5%.
Houser (2004) | Confused:
High randomness and decision errors: 24%
Fallucchi (2021) |Others:
Neither reciprocation nor strategy: 22% – 32%
Fallucchi (2019) |Various:
Unpredictable contributions: 16.5%